World's Fastest Rendering Data Visualization Controls for Building Stunning Apps
Run light-weight dashboard Run extreme dashboard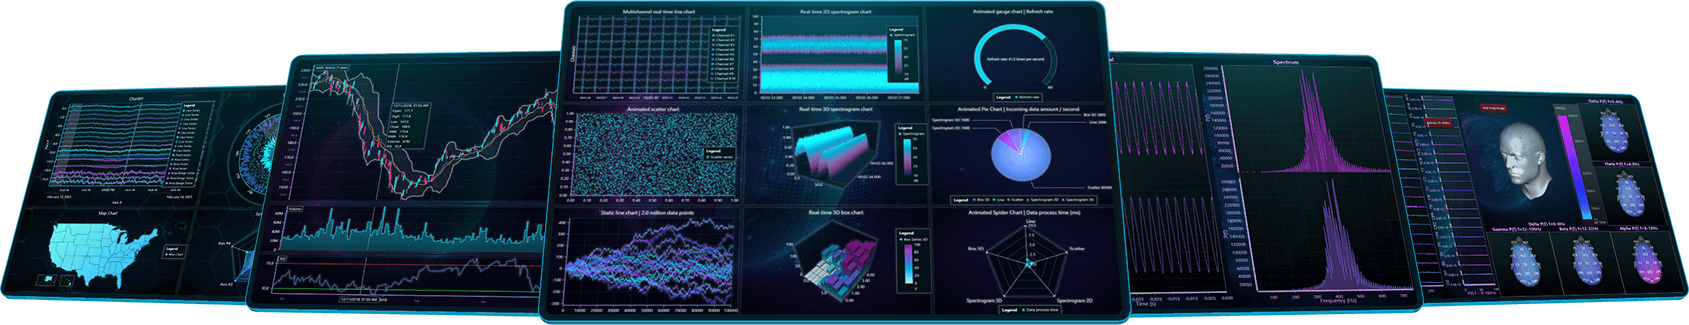
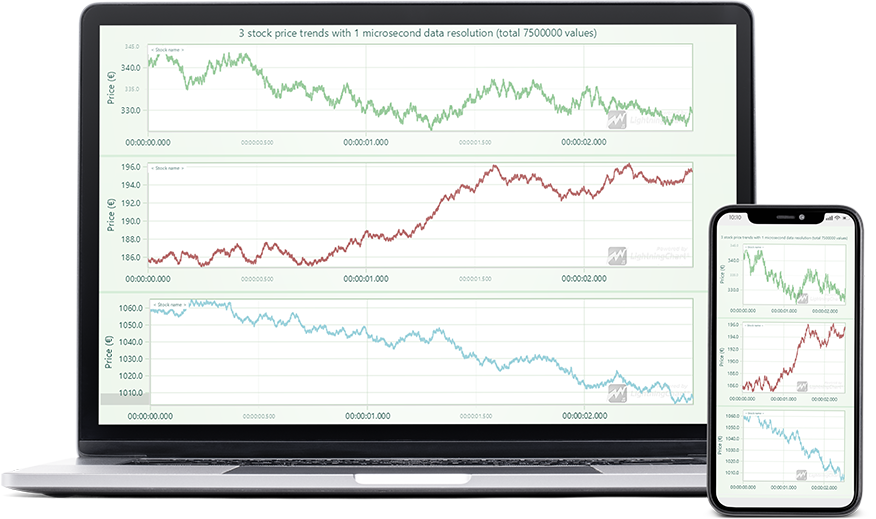
World's Fastest Rendering Data Visualization controls for building stunning apps
World's Fastest Rendering Data Visualization controls for building stunning apps
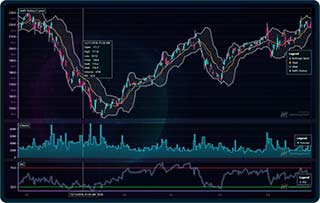

Next-generation charting apps are built with LightningChart
LightningChart is the most powerful high-performance charts framework ready to fulfill any performance requirement.
Develop real-time and demanding data visualization applications thousands of times more powerful than any other charting library.
Modern & cross-platform app development
( { theme. )
Integrate beautiful high-performance charts and dashboards into web, mobile, cloud, desktop, server, IoT, and intranet applications.
Faster development using our 10+ project templates available.
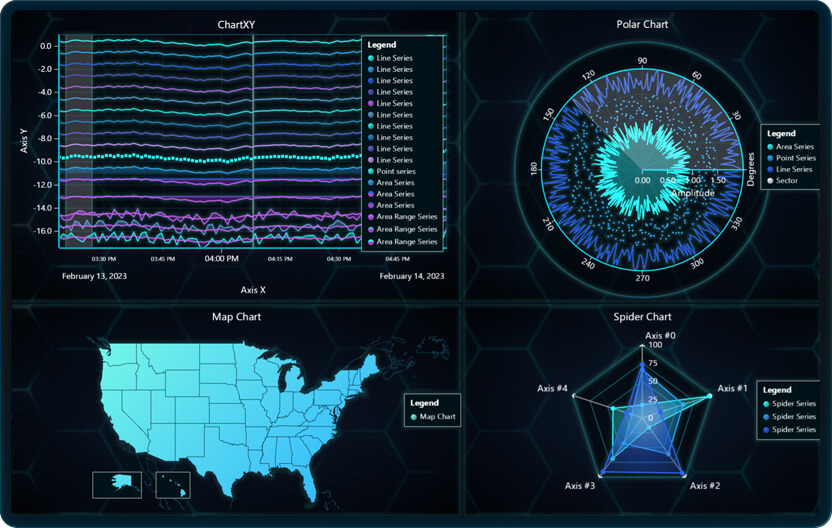
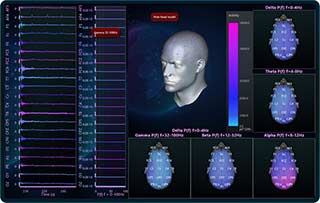
Beautiful data visualizations
Use LightningChart high-performance charts components as standalone dashboards or integrate them to users applications.
Adjust themes, colors, and features to your liking with fully customizable charts without compromising performance.
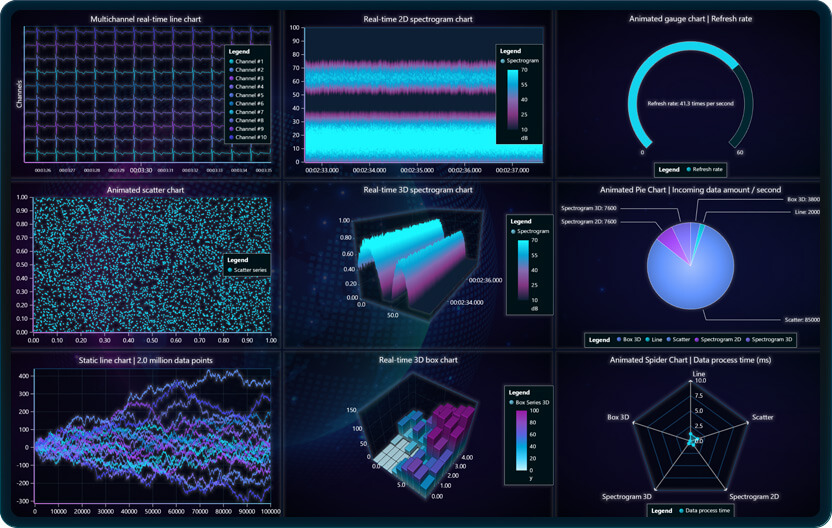
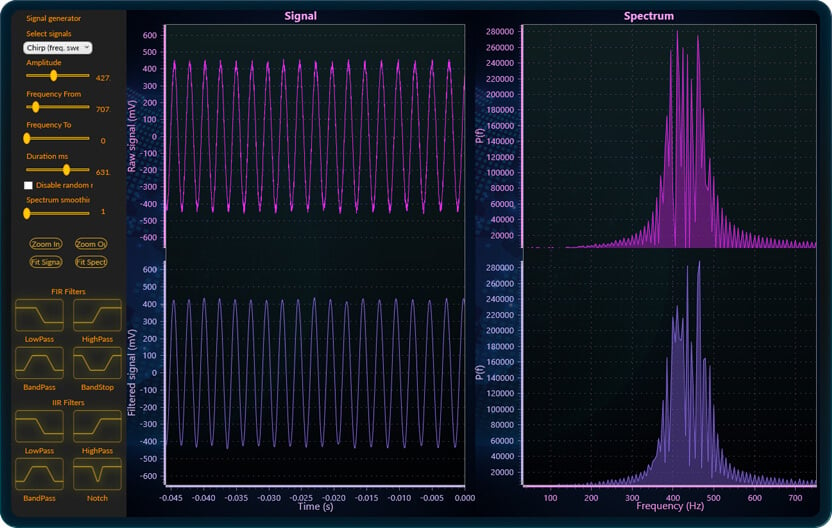
See More ChartsWhy performance matters in data visualization?
High-performance guarantees faster and more efficient components and applications.
The secret of LightningChart high-performance charts components is hardware-accelerated visualizations that unlock larger processing power and better user experiences made for intensive real-time applications.
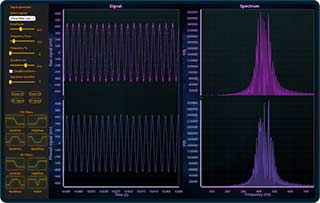
Graphics technologies
LightningChart JS and .NET use the latest WebGL and DirectX technologies, respectively.
WebGL and DirectX technologies secure that applications will redraw and update graphics at lightning speeds, handle more data, and reduce the computing power requirements.
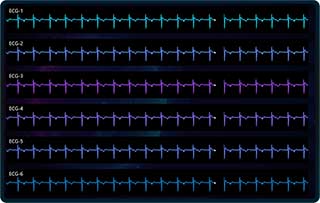
Benefits of GPU-acceleration
LightningChart high-performance charts components offload the heaviest computations to GPU's, which are relatively much more powerful than CPU's.
LightningChart’s visualization controls are GPU-accelerated charts rendered at the highest FPS and fastest load-up speeds.

Most popular .NET charting control
in Visual Studio Marketplace
25,000
TIMES INSTALLED

LightningChart .NET
visualizes up to
1,000,000,000,000
DATA POINTS

LightningChart JS
visualizes up to
2,000,000,000
DATA POINTS

More than
200 VISUALIZATION EXAMPLES
Up to
1,000,000 TIMES FASTERTHAN OTHER LIBRARIES
What users say about LightningChart
“We needed a high-performance charts and graphic library dedicated to our real time data measurements that was performant enough to cope with the functioning speeds of our systems and with the high quantity of data involved. In that aspect, LightningChart fulfils its duty perfectly.”
By Raphael Ruis
“Using Arction LightningChart, we were able to deliver a Class III medical research system in under 9 months. Development was very quick thanks to their huge library of examples.”
Patrick Miller, Michael Hammann
“We are currently using a variation of the horizontal chart and we are satisfied with the many functions provided by LightningChart® .NET. I want to give a particularly good score for customer support, it has been very professional and helpful.”
By Wanny, DAIMS
“We are very satisfied with LightningChart’s performance. Despite its lightning-fast speed, we are amazed by the high quality of charts produced. What is worth to mention is their technical support: very responsive, fast and patient. The whole team has high professional knowledge and skills, which is why I am glad about the decision of choosing LightningChart.”
By Shengsong Liang
“My project was looking to retire our ‘in house’ graphing package, and look for a 3rd party product to use instead. After weeks of research, no one came close to LightningChart’s graphing package. Its speed and feature set where unparalleled of the almost 12 packages I tried. I’ve been developing with them for two years now, and they have a great support forum, and address emails immediately. I recommend them, its a great product.”
By greggorob64
“We are SOOO impressed on LC as it is really a product that greatly handles MASSIVE data in our real-time application. No delay nor choppy.”
Joel S
“LightningChart performs extremely well and real-time charts, heatmaps and 3D surfaces are the most advanced in the industry, IMO.”
S_Steph

Download LightningChart
LightningСhart JS
Best for developing web, mobile, desktop, IoT, Cloud, and Intranet applications that require fast data processing times.
The library features 100+ charts, examples source code, and 10+ framework templates including Angular, React, Quasar JS, Ionic, etc.
WebGL-rendered and GPU-accelerated charts for delivering the highest performance and the best user experience.
LightningСhart .NET
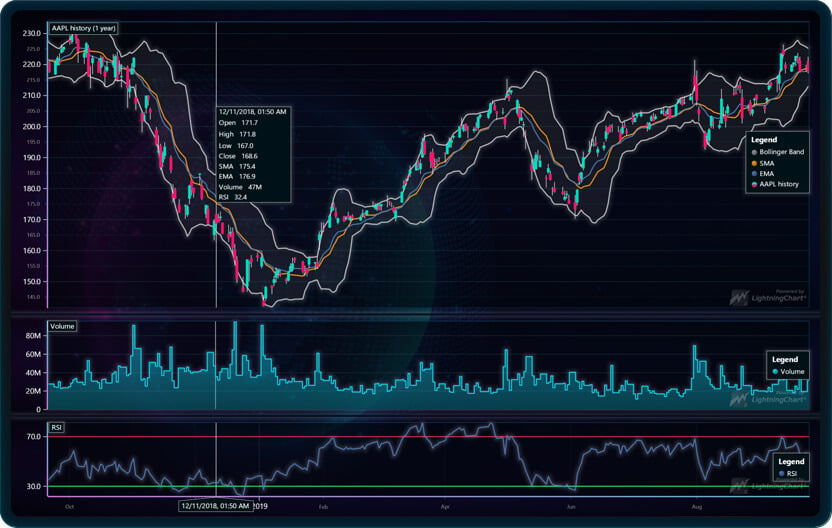
Ideal for developing highly demanding desktop applications, e.g., scientific, engineering, finance, medicine, etc.
The library features 100+ chart types, signal tools, and examples source code supported in WinForms, UWP, and WPF.
Hardware-accelerated controls for lightning-fast rendering performance and efficient use of resources
Read our success stories
Husqvarna AB
Husqvarna has developed a software tool that measures real-time log data from the outdoor power tools’ motors and displays it in a chart using LightningChart high-performance charts.
Müller BBM-VAS
The PAK cloud services provide an infrastructure that enables data management across multiple data sources and applications, specifically designed to capture dynamic and physical data.
SES S.A.
SES is working on developing a satellite telemetry web application featuring high-performance charts and data visualizations. This innovation will be used in SES satellite network operations center for controlling satellites and conveying offline historical data analysis.
If you have any questions, feel free to contact us!
©LightningChart Ltd 2024. All rights reserved.