Show Deviations (with Color?)
Moderator: Queue Moderators
-
blakeadkins

- Posts: 44
- Joined: Tue Feb 25, 2014 7:49 pm
Show Deviations (with Color?)
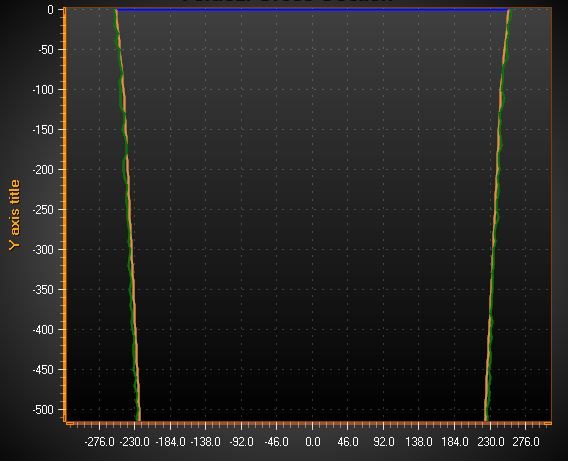
I have a cross section of a 3D scan and I have ideal points and the measured points and I'm trying to graphically show the deviation from ideal (within certain tolerance, green/ medium tolerance, yellow/ outside tolerance, red). I've seen on the forum that using a PointLineSeries to show different colors won't work so I'm curious if there's another way around that. Here's an image of my current state
-
ArctionPasi

- Posts: 1367
- Joined: Tue Mar 26, 2013 10:57 pm
- Location: Finland
- Contact:
Re: Show Deviations (with Color?)
Three different approaches come to my mind right now.
1. Changing the curve color can be made with event . But it's pretty tricky because the event assumes screen coordinates, and you may have to convert screen coordinates to axis values with axis.CoordToValue method to find out the deviation on that point.
2. Setting another stacked Y axis or chart below this chart, and displaying the deviation value as separate line, and coloring that with ValueRangePalette. Pretty much like in this picture
X values same than in the cross section line, Y values deviation.
3. Setting a colored point in each line point location. That can be done with SeriesEventMarkers, which is sub-property of PointLineSeries. One marker for each point. Each marker can have unique color.
1. Changing the curve color can be made with event
. But it's pretty tricky because the event assumes screen coordinates, and you may have to convert screen coordinates to axis values with axis.CoordToValue method to find out the deviation on that point. 2. Setting another stacked Y axis or chart below this chart, and displaying the deviation value as separate line, and coloring that with ValueRangePalette. Pretty much like in this picture
- Palette-colored line
- palette_colored_line.jpg (126.27 KiB) Viewed 6169 times
3. Setting a colored point in each line point location. That can be done with SeriesEventMarkers, which is sub-property of PointLineSeries. One marker for each point. Each marker can have unique color.
LightningChart Support Team, PT