Page 1 of 1
Many charts performance
Posted: Tue Oct 25, 2016 2:01 pm
by matus
Hello,
we are experiencing very bad performance when we display more charts (20 in this example).
When resizing the container with the charts (collapsing part of the screen) freezes the UI for several seconds (up to 10 seconds).
Each chart has 2 point line series with cca 3000 points. One of the series has visible circular points and the other is clickable and has circular points with transparent color.
I found out, that the transparent points are causing the problem, because clickable.PointStyle.BorderWidth = 50. Reducing the width improves the performance (but it still takes 2-4 seconds).
The width is so big, because we are using the invisible points to detect user interaction with touch (we need quite big area to have good user experience).
Is there another way to detect clicks in an area around the point from the series?
Is there a way to improve performance with this amount of charts in general?
Re: Many charts performance
Posted: Tue Oct 25, 2016 2:26 pm
by ArctionPasi
Hi Matus,
The size of the point here is the major problem. That size of round point is composed of hundreds of small triangles. Please use Rectangle shape.
Also ensure you are running with 7.2 version, with DirectX11 engine. You can check that by using chart.GetRenderDeviceInfo().
Best regards,
Pasi
Re: Many charts performance
Posted: Tue Oct 25, 2016 2:47 pm
by matus
I don't remember why we used the border, but I tried to set the actual width and height of the point and the performance is much better (4-5 seconds). The shape doesn't make any difference.
Nevertheless the performance is poor also with this improvement.
Is that a limitation that we cannot pass? Is having 20 charts on the screen a supported use case?
Re: Many charts performance
Posted: Tue Oct 25, 2016 3:04 pm
by ArctionPasi
Can you please send screenshot of your app, so I could instruct you better? Also if you can post a small VS project here to reproduce the issue, that would be nice.
Having a few multi-segment charts instead of dozens single-segment chart saves a lot of performance and memory resources.
What is your GPU type,btw? If you use GPU-Z tool, can you check what kind of GPU load does it show?
Re: Many charts performance
Posted: Tue Oct 25, 2016 3:15 pm
by matus
We use Dx11 rendering, here's the rendering info:

- renderInfo
- renderInfo.PNG (19.45 KiB) Viewed 35117 times
I checked the GPU-Z, I'm not sure what info is relevant there, but here's a screenshot:
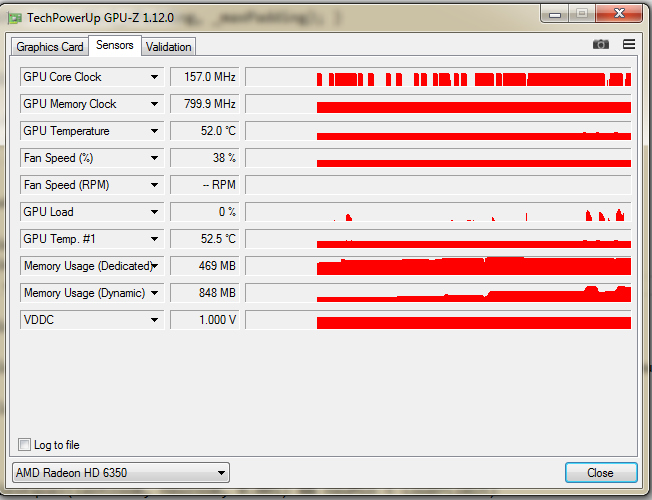
- gpu-z
- gpu-z.PNG (51.43 KiB) Viewed 35117 times
the Load peaks at 52% during the UI freeze
here's the screenshot of the app, you can see the collapser on the left, the charts are in a scrollviewer (see the scrollbar on the right side)

- app-screen
- app-screen.PNG (239.63 KiB) Viewed 35117 times
Re: Many charts performance
Posted: Tue Oct 25, 2016 3:22 pm
by ArctionPasi
That GetRenderDeviceInfo doesn't reveal anything. Please call it after chart has rendered at least once, e.g. in double-click event handler.
Re: Many charts performance
Posted: Tue Oct 25, 2016 3:27 pm
by ArctionPasi
Are all the charts in scrollable container? If so... the overall renderable area is quite huge.
For this kind of purpose, we would recommend using multi-segment chart instead.
Re: Many charts performance
Posted: Tue Oct 25, 2016 3:32 pm
by matus
updated render info:

- render info
- renderInfo.PNG (20.67 KiB) Viewed 35115 times
Re: Many charts performance
Posted: Tue Oct 25, 2016 3:35 pm
by matus
what is a multi-segment chart? is it some special chart type that I can see in your demo application? or just a single chart with multiple series?
Re: Many charts performance
Posted: Tue Oct 25, 2016 4:59 pm
by ArctionPasi
Multi-segment chart has several Segments specified in ViewXY.AxisLayout.Segments. Setting AxisLayout.YAxisLayout=Segmented applies it.
There's e.g. this example in the demo applications:

- Multi-segment chart
- multi-segment-chart.jpg (526.32 KiB) Viewed 35113 times