Page 1 of 1
IntensityGridSeries, Wireframe issue
Posted: Fri Jan 20, 2017 2:36 pm
by lukoprovandrey
Hi guys,
I use IntensityGridSeries with WireframeType = SurfaceWireframeType.Wireframe. White squares have 0 value. How can I display this squares without borders?
How it looks without borders:
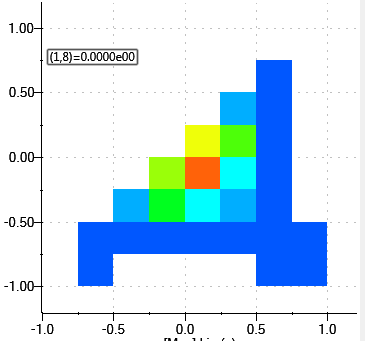
- Screenshot_6.png (6.76 KiB) Viewed 14982 times
expected (something like this

):
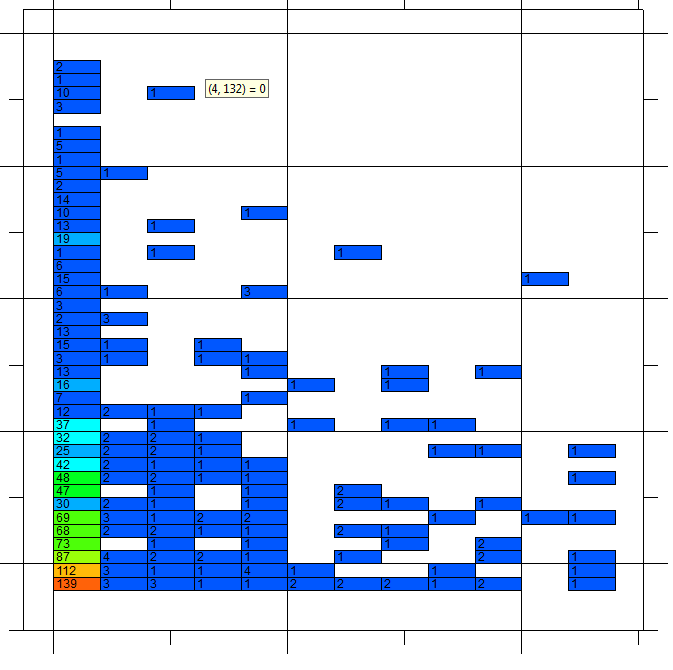
- Screenshot_5.png (22.48 KiB) Viewed 14982 times
Re: IntensityGridSeries, Wireframe issue
Posted: Sun Jan 22, 2017 7:26 am
by ArctionPasi
Hello.
If you want to have borders (and text) in each cell, I would recommend creating a table of AnnotationXY objects and setting fill color from palette to them.
Re: IntensityGridSeries, Wireframe issue
Posted: Mon Jan 23, 2017 6:49 am
by lukoprovandrey
I use annotations, but when I draw much data it cause of performance problem (when resize, redraw and etc.) It is why I wrote here)
Also, I just need borders, a text is not needed.
Re: IntensityGridSeries, Wireframe issue
Posted: Mon Jan 23, 2017 8:44 am
by ArctionPasi
Hello,
the wireframe of IntensityGridSeries isn't suitable for this kind of border.
Using FreeformPointLineSeries with IndividualPointColoring = true, LineVisible = false, and border shown in the points, may work for you. Fast it is at least... But you'll have to position the points correctly and probably recalculate point size in screen coordinates when resizing the chart.
Re: IntensityGridSeries, Wireframe issue
Posted: Mon Jan 23, 2017 12:16 pm
by lukoprovandrey
Thanks, will try