Page 1 of 1
problem with intensity grid series
Posted: Thu Mar 01, 2018 2:00 am
by fredd41
hi
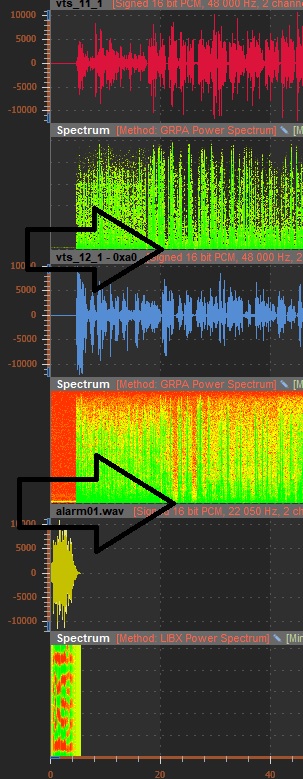
when I attach an intensity grid series to an Y-Axis :
Dim grid = New IntensityGridSeries(chart.ViewXY, XAxis, YAxis)
the grid is one pixel too high
fred

- preview2.jpg (243.49 KiB) Viewed 9068 times
Re: problem with intensity grid series
Posted: Thu Mar 01, 2018 2:02 am
by fredd41
grid.ShowInLegendBox = False
grid.Title.Visible = False
grid.ValueRangePalette = CreatePalette()
grid.FullInterpolation = False
grid.Optimization = IntensitySeriesOptimization.StaticData
grid.LimitYToStackSegment = True
grid.SetRangesXY(0, fileDuration, Y.Minimum, Y.Maximum)
grid.SetSize(NumberOfFrames, SamplesPerFrame)
grid.Tag = New MyTag("3D", Y.Axis.Tag.ToString)
grid.PixelRendering = True
grid.MouseInteraction = False
chart.ViewXY.IntensityGridSeries.Add(grid)
Re: problem with intensity grid series
Posted: Fri Mar 02, 2018 1:48 pm
by ArctionKestutis
Thanks for the report.
Indeed looks like one pixel is lost at the bottom of HeatMap. We will investigate this issue as soon as possible.
If you need/want to cover this pixel, you can set Xaxis.VerticalAlign = Top with AxisThickness >1.
All the best.
Re: problem with intensity grid series
Posted: Fri Mar 02, 2018 6:33 pm
by fredd41
works only for the last segment
- preview2.jpg (113.92 KiB) Viewed 9059 times
Re: problem with intensity grid series
Posted: Wed May 23, 2018 10:41 am
by ArctionKestutis
Hi Frederick,
Issue has been fixed in version 8.3.1.1. Could you confirm the fix?
All the best.