LightningChart JS performance tester results
May 2021
All the charts were set to the same size and simplest appearance. All the data come from performance tester on 3rd of May, 2021 with newest browser versions. Based on this compatible performance tester platform, we can provide realistic testing data.
Run the performance tester online.
Device hardware and Operating system:
SoC/CPU
RAM
GPU
Screen Resolution
Screen Refresh Rate
Browser
Operating system

AMD Ryzen 7 2700X
16.0 GB
NVIDIA GeForce GTX 1070
1920x1080
60Hz
Chrome version 75.0
Windows 10 64-bit OS

Intel® Core TM i5 3210M
8.0 GB
NVIDIA GeForce 610M
1600x900
60Hz
Chrome version 75.0
Windows 10 64-bit OS
Qualcomm Snapdragon 855
8.0 GB
Adreno 640
3120x1440
90Hz
Chrome full version 90.0.4430.91
Android 11 OS

Apple A8X
2.0 GB
PowerVR GXA6850
2048x1536
60Hz
Safari full version 13.3.1
iOS 13.3.1
Performance Test Legend
Average FPS
FPS was measured by using JavaScript API: window.requestAnimationFrame starting from after Chart is first loaded and until the test is completed
In the result table, the “goodness” of the value is shown in color, as well as a bar.

Loadup
Delay between initiating Chart creation to first rendered frame is measured. This logic relies on window.requestAnimationFrame too. For static tests this delay also includes the processing and rendering of all the data
Data generation delay
Performance tests generate random test data. This processing time is data generation delay
Test results
Full test results are in the PDF-document below. In all series tests a data array was generated and passed to each chart rendering delay was measured. All charts were set to equal size, and simplest possible appearance. The tests were performed with various data point counts. Results include following series:
- Test result 1: XY Scatter Series
- Test result 2: XY Point,Line and Area Series
- Test result 3: OHLC Series and Dashboard Cells
- Test result 4: 3D Point Series
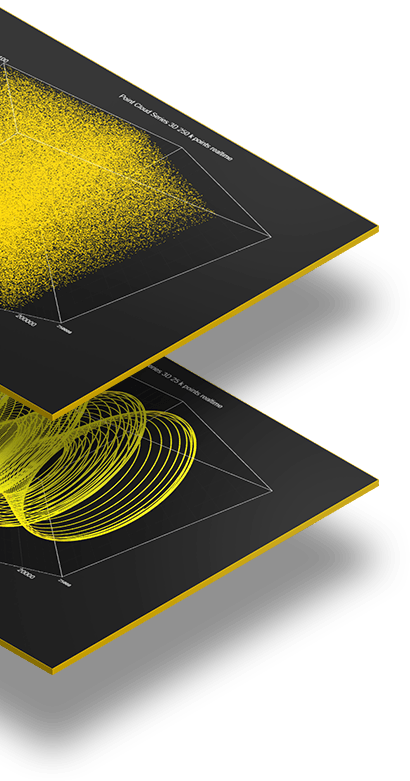
- Test result 5: 3D PointCloud Series
- Test result 6: 3D Line Series
- Test result 7: 3D PointLine Series
- Test result 8: 3D Surface Grid Series
- Test results 9: 3D Surface Mesh Series
- Test results 10: 3D Box Series
- Test results 11: Polar Chart Series
Scrolling Line Series
Series types in the test are: Point, Line and Area. The data point was generated in random position in the chart.

3D Point Cloud Series
A data array is generated and passed to each chart rendering delay was measured. All charts were set to equal size, and simplest possible appearance. The test was performed with various data point counts.
Each data point was represented as a 2D point shape. The data points were generated in random position in the chart.

3D Surface Grid Series
A data array was generated and passed to each chart rendering delay was measured. All charts were set to equal size, and simplest possible appearance. The test was performed with various data point counts.
A 3-dimensional surface was drawn based on the points. The data point was generated in a random pattern, which is repeated along one axis of the chart.

3D Box Series
A data array was generated and passed to each chart, and rendering delay was measured. All charts were set to equal size, and simplest possible appearance. The test was performed with various data point counts.
Each point was drawn as a 3D box. The data point was generated in a random pattern, which was repeated along one axis of the chart.

Polar Chart Series
A data array was generated and passed to each chart, and rendering delay was measured. All charts were set to equal size, and simplest possible appearance. The test was performed with various data point counts.
Series types in the test were: Point, Line, Point Line and Area. The data points were generated in random position of the chart.

Conclusions
LightningChart JS is cross-platform data visualization library, which can run on practically in all existing platforms, including Microsoft Windows, Linux, MacOS, iOS and Android. LightningChart JS is Capable of handling 10M+ points in high-end hardware in streaming line charts, and is capable of handling 500k points with different series in desktop, laptop and phone, and 10k points in mid/low-end tablets and phones.
Based on the collected data, LightningChart JS is a top, high-performance charting library for developers needing to make the best performing solutions to the end users.
If you have any questions, feel free to contact us!