Flow cytometry is an every-day method in research and clinical practices for analyzing individual cells within heterogeneous samples (like blood sample, for example).
It is based on observing the behavior of pointed light, and can rapidly analyze multiple parameters from each cell.
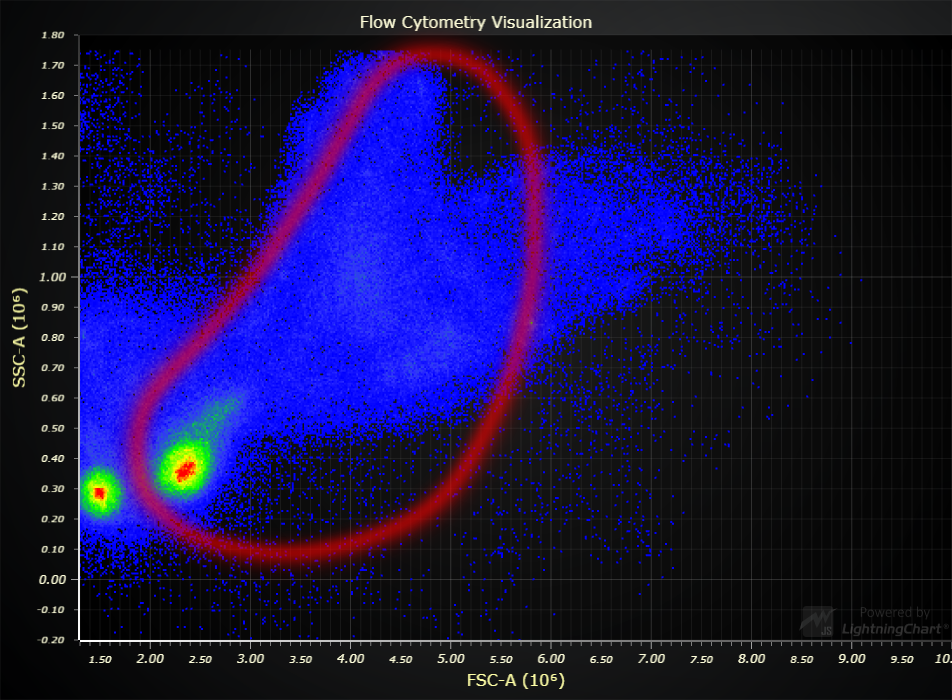
In this example, all the samples are displayed in a single chart which displays the following information:
Forward scatter (FSC). This is measured based on how much light is scattered along the path of the light source.
Side scatter (SSC). This is measured based on hot much light is scattered at a ninety-degree angle relative to the light source.
Each point in the chart is one sample. When multiple samples have the same SSC and FSC measurement, the point color is adjusted (red = most overlapping samples).
In practice, the data from flow cytometry is filtered through several steps that each look at the relationship between some data attributes. This example is just 1 of these steps.
As an example of this filtering, some application might select some valid range of FSC/SSC values that will be considered in later analysis steps.
The go-to framework for visualizing flow cytometry is definitely "R", a software environment for statistical computing and graphics.
Here are some scenarios where we believe LightningChart is a strong alternative:
Real-time data
LightningChart excels at fast changes to data sets, if your application continuously receives data, especially with high rates like several times in second, LightningChart is what you need.
Data interactions
In some cases users might need the ability to interact with data (panning, zooming, cursor, etc.). In many statistical tools, this kind of features do not exist since only a minority would have an use for them. Additionally, even if present they might not perform too well especially with large data sets.
Deployment in the internet
R is a desktop application. In most cases, users will install it on their own computer and directly interact with data sets to utilize a shared data visualization application.
LightningChart JS, on the other hand, is a web library. LC JS projects can be conveniently embedded inside web pages, mobile and even desktop applications.