All the power of LightningChart JS now available in R
We’re glad to introduce our data visualization package for R users who are interested in using LightningChart JS in their projects. In the last year, we developed a series of 10+ framework development templates and we’re finally introducing the LightningChart JS data visualization package for R.
This package is useful if you need to create interactive data visualization projects that require high-performance visualizations that can handle a large number of data points and interactivity. This data visualization package for R is also available directly in GitHub.

What can you do with the LightningChart JS package?
Scatter Charts
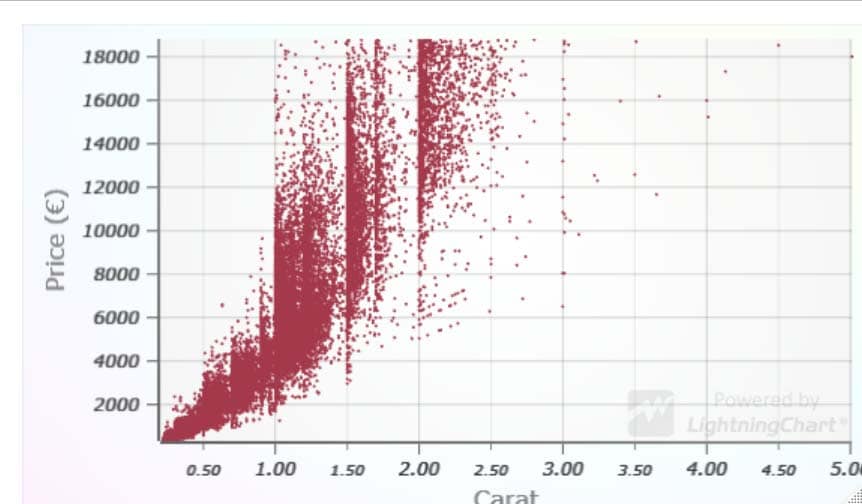
The interactive features supported include zooming, panning, and data cursor. You can visualize up to 75 million data points. Circle, square, and triangle markers are supported as well as individual point sizes and transparent points. Here’s a visualization of the diamonds dataset created using the LightningChart JS package:

Line Charts
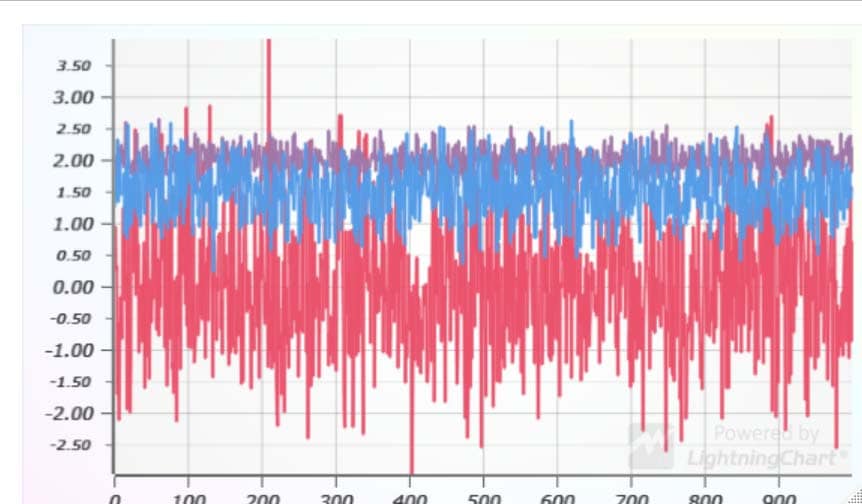
With the LightningChart JS package, you can also create fully interactive line charts with zooming, panning, and data cursor functions to visualize up to 500 million data points. Here’s an example of a line chart:

Heatmaps
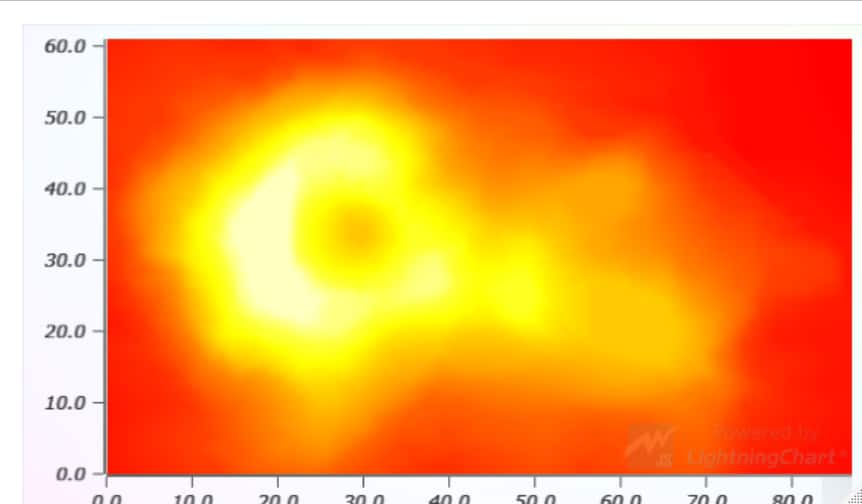
LightningChart JS heatmaps can visualize up to 5.6 billion data points and support full interaction features including zooming, panning, and data cursor. The heatmaps visualizations support the following R color palettes: native, RColorBrewer, and Viridis.

Getting started with the LightningChart JS package
You can get started by installing the latest version of the lc4r package via R devtools. If you need to install de devtools, you can do so by executing install.packages("devtools") in the R editor window or console.
Then, please install the latest version of the package with the following command devtools::install_github("Arction/lc4r")
More visualizations available + code references
Happy coding!
