Stacked Area Chart
The stacked charts are a popular visual aid used for categorizing and comparing the parts of a whole using different colors to distinguish the categories.
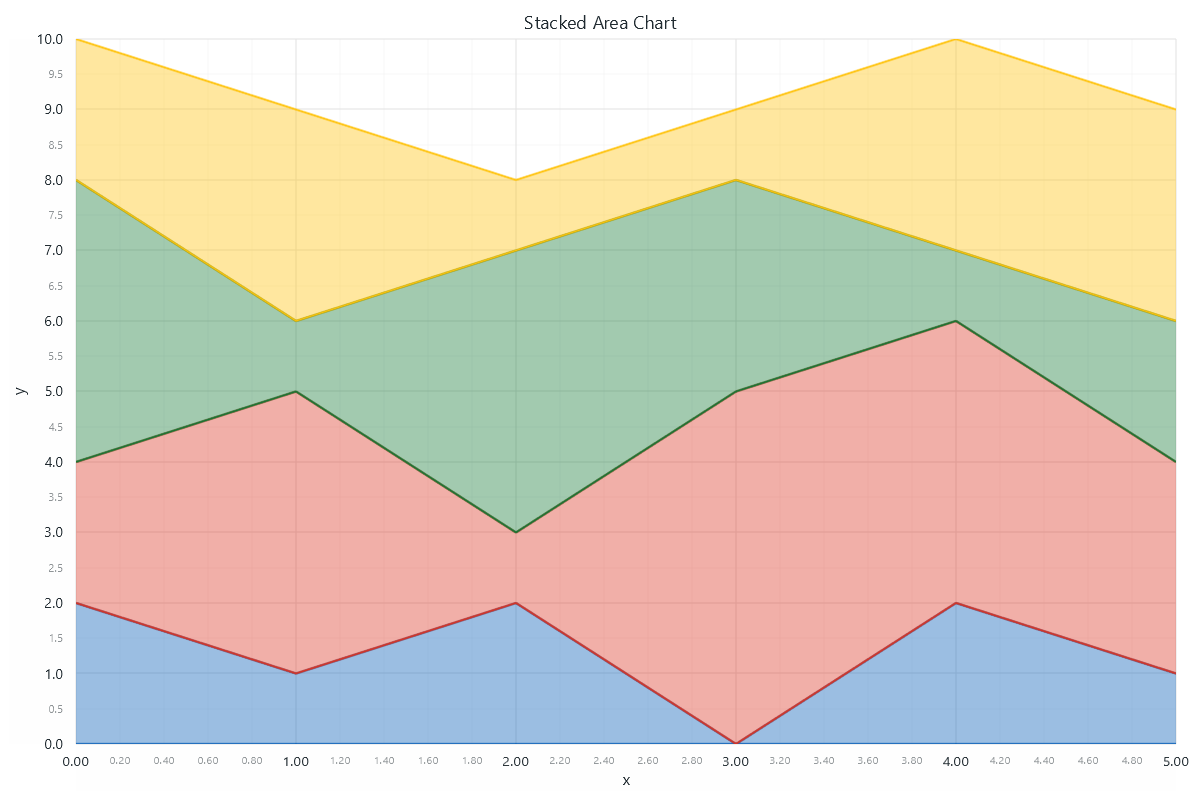

import lightningchart as lc

lc.set_license('my-license-key')

data = [
    [2, 1, 2, 0, 2, 1],
    [4, 5, 3, 5, 6, 4],
    [8, 6, 7, 8, 7, 6],
    [10, 9, 8, 9, 10, 9],
]

chart = lc.StackedAreaChart(
    data=data,
    theme=lc.Themes.White,
    title='Stacked Area Chart',
    xlabel='x',
    ylabel='y'
)
chart.open()