Qlik Data Visualization Add-Ons
Improve your data visualization in Qlik with LightningChart open-source extensions!
LightningChart JS has developed two data visualization add-ons for Qlik. These extensions are perfect for you if you’re familiar with Qlik data visualization and BI systems.
The extensions are for XY charts and 3D charts.
Additionally, LightningChart has released several other data visualization templates that’ll help you integrate LightningChart JS charting library into your project development.
XY Charts Add-On for Qlik
The following extension has been tested with 1 million data points.
The purpose of using the LightningChart data visualization extension for Qlik is to allow you to create fully customizable XY charts.

With this Qlik data visualization add-on, you can:
- select the chart’s series type that you need to use, e.g., line series, point line series, or point series.
- set the color of the line series.
- set the color of the points, if you selected the point line series or point series.
- enable or disable the animation.
- set the thickness of the lines.
- set the size of the points.
- set the title of the chart.
XY charts examples
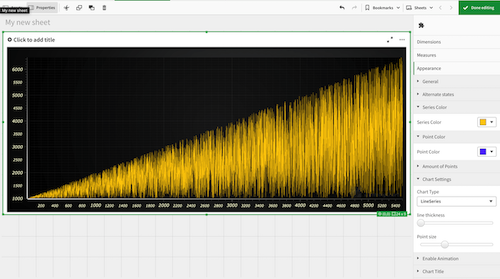
Line Series
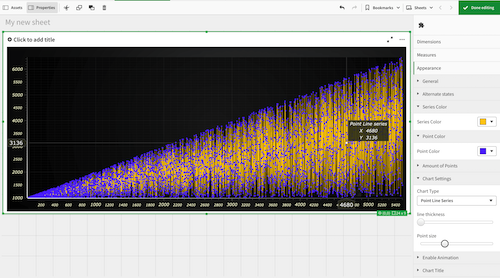
Point Line Series
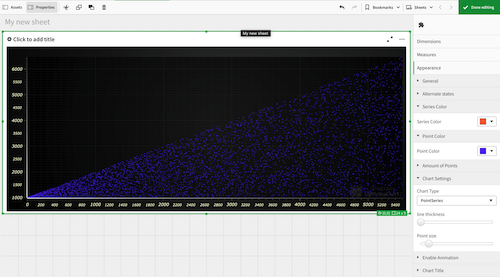
Point Series
3D Charts Add-On for Qlik
The following extension has been tested with 100,000 data points.
With the LightningChart data visualization extension for Qlik you can create 3D charts that are currently not available in the default library of the SaaS.
With this add-on, you can create fully customizable 3D charts and expand its customization by referring to our code to create more and advanced 3D charts such as 3D bar charts, 3D mesh charts, or 3D surface charts.
For more examples, please visit our interactive JavaScript examples.

With this Qlik data visualization add-on, you can:
- change the point size.
- change the color.
- set the titles for each of the axes.
- set the title for the chart.
- set a predefined amount of points rendered.
Usage & Installation
Both XY and 3D charts extensions are open-source and only require a license.
NOTE:
As Qlik Sense does not support WebGL rendering, the user will experience a significant drop in the charts’ performance compared to the performance levels of LightningChart JS.
In order to get the highest possible performance, please use Qlik Cloud or a web browser.
To install, place folder with selected Extension to C:\Users<User Name>\Documents\Qlik\Sense\Extensions or in QlikCloud */qlikcloud.com/console/extensions/ -> ‘Add’ and upload extension.zip folder
To use the extension in QlikCloud go to ****/qlikcloud.com/explore/spaces/all and press ‘Add new’
Happy coding!
Get the Add-Ons from GitHub
If you have any questions, feel free to contact us!