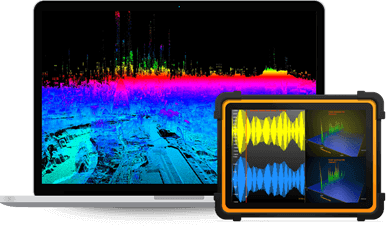
High-performance WPF, WinForms & UWP .NET Charts & Graphs
LightningChart .NET can visualize up to 1 TRILLION data points in real-time.
World’s Fastest .NET Charts
v.11.0.1 (Free trial for 30 days)
XY charts
The most definitive 2D cartesian chart, with the best rendering performance in the industry. Visualize your complex and huge data sets, with our optimized series types, shared X axes, built-in real-time scrolling modes and industry leading configuration options.
- Series types: sampled data (discrete signal), line, scatter points, point-line, freeform point-line, areas, high-low, polygon, stock (OHLC, candle-stick), bar, band, constant line, intensity grid, intensity mesh
- Real-time monitoring scrolling modes: scrolling, sweeping*, stepping, oscilloscope style level triggered
- Heatmaps with contours, wireframe, contour labels
- Stencil for rendering intensity series inside polygon, map region
- Annotations, markers, data cursors
- Persistent rendering layers
- Several legend boxes in the same chart
- Linear and logarithmic axes, X axis scale breaks
- Several configurable vertical segments in chart, layered / stacked
- Dozens of properties to control zooming and panning behavior
* sweeping mode as built-in, no other charting provider has this.
Download
Trader charts
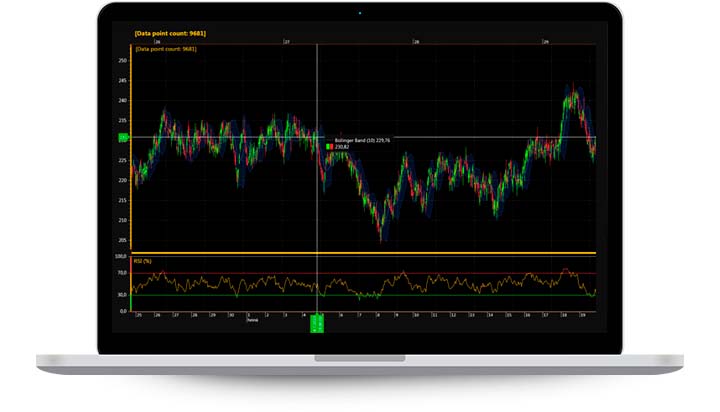
Easy-to-use, easy-to-integrate, trading charts with basic Technical Indicators and Drawing Tools. The easiest approach for making apps for Trading & Technical Analysis.
- Data fetching from web server, or supplying it by code, or reading it from CSV file
- Stocks search by name or symbol
- Several color themes
- Chart types selection: mountain, line, candle-sticks, bars
- Technical indicators, such as SMA, EMA, WMA, Bollinger band, RSI, MACD
- Drawing tools, such as Trend line, Linear regression channel, Fibonacci retracement, Fibonacci arcs, Fibonacci fan, Freehand annotation
- Chart segments management and resizing
- Technical indicators Stochastic Oscillator & Money Flow Index are now supported
The Trader library is built over fast & robust LightningChart .NET API, and the Trader library source code* is provided free-of-charge, for all subscribers.
* Note: LightningChart .NET API Source code itself is available as paid option to subscription.
Download
3D charts
Visualize your data in informative and interesting way in 3D XYZ cartesian chart view. 3D charts for WPF and Winforms
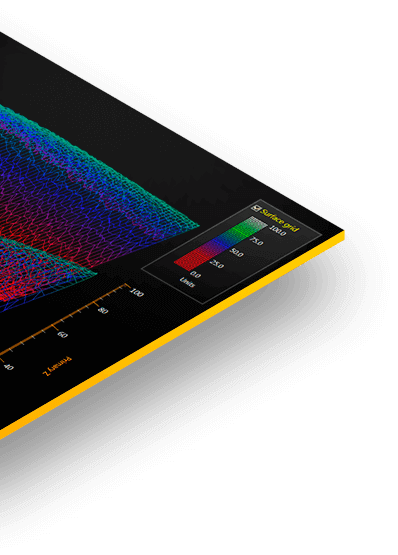
- Series types: surface mesh, surface grid, waterfall, polygon, rectangle planes, mesh models, line, point-line, scatter points, bar and pie charts
- 3D scene settings with multiple light sources
- 3D models importing in .obj format
- Gigantic surface sizes of over 4096x4096, depending on available memory
- Includes ViewPie3D, to visualize pie and donut charts in 3D
- Linear and logarithmic axes
Maps
Maps enable using vector maps or on-line tile maps for visualization of geographic data. The maps are visualized in ViewXY, and allows combining e.g. routes, heatmaps, or arrows in the same visualization. The maps use equirectangular projection.
- On-line tile maps: supports street maps and satellite imagery
- Dozens of maps: World, continents, specific areas
- Multi-layer: land, lakes, rivers, roads, cities etc
- Map import from ESRI shape file data
- Combining other XY series in the visualization
- Axis scales presented in selectable geographic coordinates formatting
Polar charts
ViewPolar allows data visualization in a polar format. The data point position is determined by angular value and amplitude. Polar view also has versatile zooming and panning features.
- Series types: line, scatter points, point-line, areas
- Line colorization per amplitude, angle or data point value
- Several polar axes per chart with unique rotation angles
- Markers
- Sectors
Smith charts
Specialized chart for radio frequency applications, like oscillator design and stability analysis. Allows simultaneous visualization of multiple parameters, like impedance, admittance, reflection coefficients scattering parameters and so on.
- Absolute and normalized scales
- Static distance and zoom adapting ticks and grid. Allows automatic generation of ticks and grid when zooming for better understanding of values, without cluttering the display.
- Automatic zoom-to-fit for whole area or data only
- Zooming and panning via ready-made mouse operations
- Tick values always visible, even when zoomed in close
- Data and grid clipping to graph area. You can show data also on outside of the graph.
Volume Rendering
Volumetric information plays an essential role in medicine, e.g. for an advanced cancer detection, visualization of aneurysms, and treatment planning. It is also used for non-destructive material testing via computer tomography or ultrasound. In addition, huge three-dimensional datasets are produced by geo seismic research, and can also be visualized by our Volume Rendering engine.
- Separate Linear Transfer function for every channel
- Volume Thresholding in accordance with voxels brightness for every channel
- Dynamic modification of Voxel range
- Manual or Automatic Adaptive sampling rate of volume data
- Three options for Volume Rendering Ray function: accumulation, maximal intensity and isosurface
- Combining 3D models and series in the same visualization
What’s NEW in LightningChart .NET v.11.0.1
New .NET Target Framework
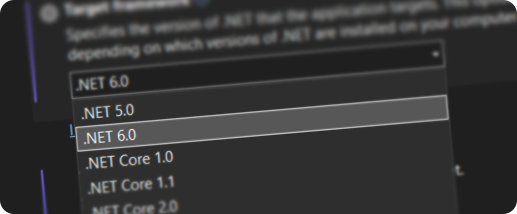
LightningChart .NET charts will be targeting .NET Framework 4.8 and .NET 6.0. The newly built editions will be available for WinForms, WPF non-bindable, and MVVM bindable versions of WPF.
Interactive Examples Improvements
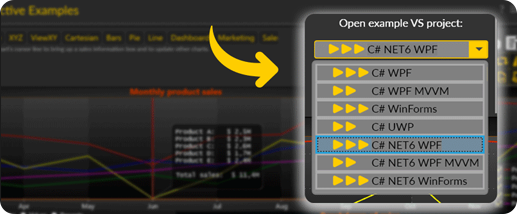
Example code can now be extracted for .NET Framework 4.8 or 6.0 in 7 different types for WinForms, WPF and MVVM (bindable), and UWP.
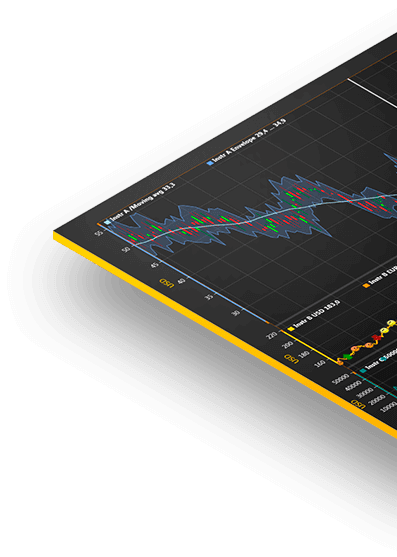
Why LightningChart .NET?
LightningChart .NET charts are the fastest 2D & 3D .NET charts data visualization SDK for WPF, WinForms, and UWP. It has been actively developed since 2009.
The charting library contains over 170 interactive .NET charts with rich functionality that is suitable for the creation of applications within the most demanding industries: science and research, engineering, economics and finance, trading, medicine, energy, space, and defense

High – Performance
Entirely GPU accelerated .NET charts controls with a full optimization towards performance of charting components. Data visualization SDK that’s developed for presenting massive amounts of data with a minimal flickering and delays.

Functionality
Wide range of 2D and advanced 3D .NET charts for the most demanding industries. Fully customizable tools and flexibility for .NET developers with the most demanding applications.

Cost – Efficiency

Take a look at our customers success stories
Find out what our customers have said about LightningChart’s .NET charts exquisite performance and functionality as well as its comprehensive support.
The highest .NET charts performance on the market
LightningChart .NET charts are an entirely GPU-accelerated and performance-optimized charting components that can display record-breaking amounts of data points in real-time. What does this mean for you?
- Real-time monitoring without flickering or delays
- High-resolution datasets
- Smooth Interactivity
- Efficient use of machine resources
- Ability to render data with old machine hardware, maintaining all advantages mentioned above
Countless hours of product development and hard work of the LightningChart development team have resulted in LightningChart .NET charts becoming an absolute charting library with unmatched performance results that would impress even the most demanding developers in the industry.
We’ve made in-depth performance comparisons with different competitors and the results demonstrate why LightningChart .NET charts is the number 1 provider of UWP charts, WPF charts, and Winforms charts.
We constantly strive for the highest performance indicators in the .NET charts industry.
For the most demanding developers
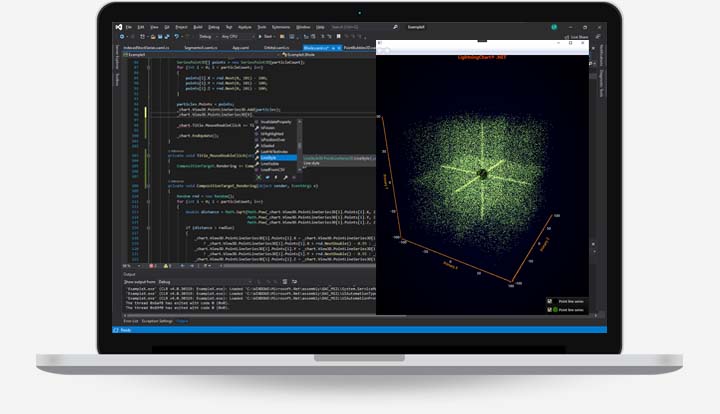
LightningChart .NET charts include a wide range of 2D, advanced 3D, Polar, Smith, 3D pies/donuts, Geographic maps & G.I.S. charts and Volume Rendering features for science, engineering, medicine, aerospace, trading, energy, and other fields.
Along with an outstanding performance, LightningChart .NET charting library offers fully customizable tools and flexibility to .NET developers within different industries.
Our technical support team is known for its ability to handle every challenge from our clients, so you will receive unlimited dedicated support during your active subscription.
LightningChart provides the following Signal Tools

SignalReader
SignalReader generates real-time data stream reading signal files in different formats: WAV (PCM), sid (biosignal file), ssd (LightningChart Ultimate Demo application sample data format). The playback can be automatically restarted with looping option.

AudioInput
Reads real-time sampled data stream from sound card line-in (using e.g. microphone) through DirectSound. The data can be forwarded to chart, AudioOutput or your own data target.

SignalGenerator
SignalGenerator is a multi-functional signal generator component. It allows combining different waveform types into single, real-time output signal. The waveform components can be set with a built-in user interface or by code.

SpectrumCalculator
Converts data between time domain and frequency domain using Fast Fourier Transform (FFT) algorithm in Digital Signal Processing (DSP).

AudioOutput
Allows real-time data stream playback via sound card line-out (using e.g. speakers) through DirectSound. The data can be fetched from SignalGenerator, SignalReader, AudioInput or other data source.
Signal Filters
Efficient computation classes for Finite Impulse Response (FIR) and Infinite Impulse Response (IIR) digital signal filtering. Enables filtering out unwanted signal frequencies. Use any external filter design tool to supply the factors.
.NET Charts Editions
For WPF, LightningChart .NET charts components are available in different binding level editions, to balance between different performance and MVVM (Model – View – View-Model) bindability needs.
As a general starting point, LightningChart recommends a Semi-bindable API.
For the best performance in WPF and multithreading benefits, select the Non-Bindable chart.
| Chart edition | Properties binding | Series data binding | Per-data-point binding | Performance |
|---|---|---|---|---|
| WPF (non-bindable) |
|
|
|
|
| WPF (MVVM) |
|
|
|
|
| UWP (MVVM) |
|
|
|
|
| WinForms |
|
|
|
|

General Information
- Full mouse-interaction, touch screen support, custom mouse interactivity extensions
- Cursors and Annotations, data colorizing with color palette, and full customizability of components
- Data breaking by NaN or other specified breaking value, in selected series types
- Numeric, Time, DateTime, Logarithmic, Geographic Coordinate System (GCS) and Custom axis scales
- Professional 5-star technical support & Hundreds of chart examples
- Full compatibility with Visual Studio 2022 & .NET 6

Rendering Technology
- DirectX 11 & DirectX 9 support
- Automatic software rendering with WARP in systems without graphics hardware and for virtual machines
- Selectable fonts quality
- HiDPI scaling support
- Can be run in both 32-bit and 64-bit modes
- Controllable anti-aliasing options
Compatibility requirements
- OS: 32-bit or 64-bit Windows Vista or later, Windows Server 2008 R2 or later.
- DirectX: 9.0c (Shader model 3 and higher) or 11.0 compatible graphics adapter.
- Visual Studio: 2010-2019 for development, not required for deployment.
- Platform .NET Framework: installed version 4.0 or newer.
- Visit the documentation for library requirements.

Get your free 30-day trial
LightningChart provides full technical support for LightningChart developers, including trial users.
Frequently Asked Questions
What is LightningChart® .NET, and what makes it unique?
LightningChart® .NET is a leading data visualization tool designed to meet the needs of software developers, especially in demanding industries like science, medicine, engineering, and aerospace. Its uniqueness lies in being the world’s fastest 2D and 3D data visualization SDK for WPF, WinForms, and UWP, offering unparalleled performance, handling billions of data points in real time, and providing over 170 chart types for diverse visualization needs. When you develop a state-of-the-art application and want to get the best charting technology, LightningChart® .NET is the solution.
Is LightningChart® .NET suitable for WinForms development?
Absolutely! LightningChart® .NET offers a WinForms chart control specifically designed for creating high-performance charts within your WinForms applications, without having to use any wrappers or adapters.
How well suited LightningChart® .NET is for WPF development?
LightningChart® .NET offers native 2 WPF chart controls: bindable and non-bindable. Bindable chart enables easily bind data and properties in MVVM style, whereas non-bindable use direct methods and properties-based APIs for absolute maximum performance.
What are the key features of LightningChart .NET?
LightningChart .NET is a powerful and lightweight charting library compatible with WPF, UWP, and WinForms. Its key features include:
- Fast rendering capabilities for high-performance visualization.
- Ability to handle billions of data points in real time.
- Over 170 chart types, including 2D, advanced 3D, Polar, Smith, Geographic maps, and Volume Rendering.
- Extensive customization options for each chart type.
- Responsive and user-friendly interface.
- Wide set of UI frameworks supported: WPF, WinForms, and UWP.
- Dedicated technical support for subscribers.
How does LightningChart.NET compare to other charting libraries?
LightningChart prioritizes performance and caters to developers working with demanding datasets and real-time scenarios. While other libraries might offer simpler APIs or free tiers, they struggle with large datasets or real-time updates, and configurability options.
What is the maximum number of data points that LightningChart .NET can visualize in real-time for WPF, WinForms, and UWP applications?
LightningChart .NET can visualize up to an impressive 1 TRILLION data points in real-time.
Does LightningChart support third-party integrations or plugins?
LightningChart provides extensive customization options, but direct support for third-party integrations or plugins may vary. However, developers can leverage the library’s flexibility to integrate external functionalities as needed.
Can LightningChart .NET be used for 3D data visualization?
Yes, LightningChart .NET supports advanced 3D data visualization, including zoomable surface plots, volume rendering, 3D pies/donuts, line charts, bar charts and LiDAR point cloud visualizations, overall offering a comprehensive solution for multidimensional data representation.
What .NET platforms does LightningChart.NET support?
LightningChart supports .NET Framework 4.8 and .NET 6.0 for WinForms, WPF (bindable and non-bindable), and UWP applications.
What are the different licensing options for LightningChart.NET?
LightningChart offers various licensing options based on development and deployment needs, licence term (perpetual/non-perpetual), developer count, floating licenses, site licenses, and functionality required. You can find more details about licences here.
Can LightningChart be used for both desktop and web applications?
While LightningChart .NET is primarily designed for desktop applications (WPF, WinForms, UWP), there is a separate solution line, LightningChart JS, specifically tailored for web applications using JavaScript.
How does LightningChart .NET ensure high-performance chart rendering for WPF, WinForms, and UWP platforms?
LightningChart .NET is entirely GPU-accelerated and optimized for performance, providing smooth and efficient chart rendering with minimal flickering and delays, even when dealing with large datasets. LightningChart has pioneered GPU accelerated charting since 2007.
Didn’t find an answer?
Are you a student?
Do you need data visualization components for your schoolwork or thesis project?
Get a LightningChart student license for free!
