.NET Volumetric Data Visualization
TutorialDevelop a volumetric rendering application with .NET charts (Theory + Application).
Updated on March 13th, 2024 | Written by human
Volumetric Rendering Application with .NET Charts
Hello!
In the previous articles, we worked with LightningChart JS, focusing on Front-End development. In my experience, working with JavaScript libraries to create charts has always been an easier or friendlier option in terms of development. But not all the time we will be able to work with JavaScript, and we will have to work on projects that use object-oriented programming languages. For these cases, LightningChart gives us a great option: LightningChart .NET.
In this article, it will be explained how to start using LightningChart’s .NET interactive tool, and how it allows us to create a volumetric rendering project compatible with Visual Studio, simply. We will be able to experiment, study, and understand the various properties that the LightningChart SDK offers us while creating a volumetric image graph as the first example of this SDK. Next, let’s dive deep into the volumetric rendering project and some theoretical background.
Project overview
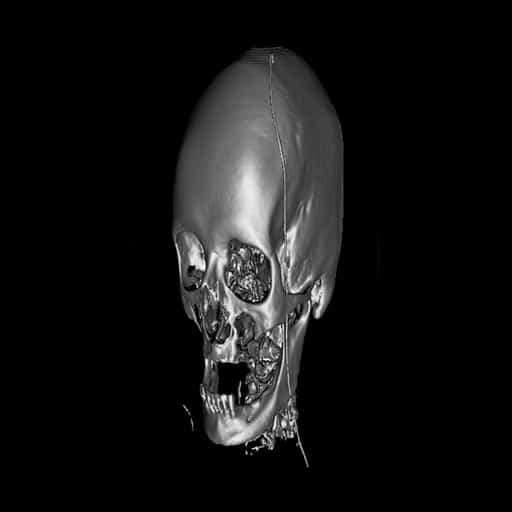
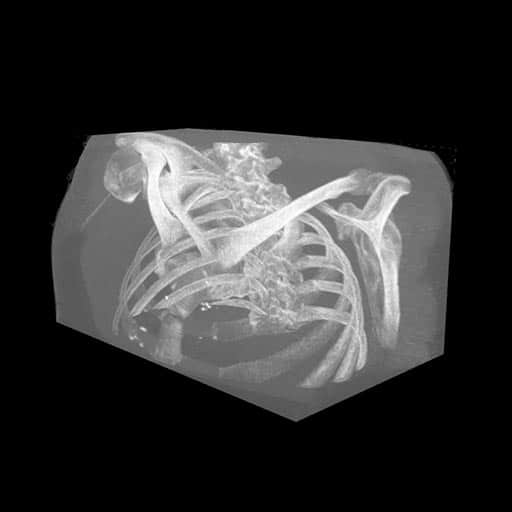
Volumetric rendering is produced when using scientific data visualization tools and datasets from various technologies including MRI. In this tutorial, we’ll code a volumetric rendering application simulating a 3D skull but you can customize the dataset and render e.g., a human thorax. Have a look at what you can create with LightningChart .NET:
To get started, please download the following project:
Download the project to follow the tutorial
Background Theory
Volumetric data is very common nowadays. The importance of this dataset type is growing rapidly due to the development of the 3D data acquisition industry. This growth is also due to the increasing possibilities of performing advanced renderings of complex medical visualizations including those of the human body. The medical datasets can be captured by various technologies, e.g. MRI, CT, PET, USCT, or echolocation. Other datasets can also be produced by physical simulations, for example, fluid dynamics or particle systems.
The set of technologies mentioned before demonstrates that volumetric information plays an important role in medicine. It is used for advanced cancer detection, visualization of aneurysms, and treatment planning. This type of data is also very useful for non-destructive material testing via computer tomography or ultrasound. In addition, a huge three-dimensional dataset can be produced by seismic research.
Volume Data
Volume data consists of voxels. A voxel is the basic volume element and it can be represented as a point in a 3D space with a certain position and a color. This allows keeping up to six scalar parameters. Usually, the points belong to the fixed grid, so the volume data can be stored as a table.
In this case, the runtime representation can be kept as a multidimensional array, and volume data can be represented as a *.csv file in a device’s local storage. However, more commonly the dataset is broken into several slices, and every slice is stored as a bitmap image. The approach allows for significantly reducing the model size due to the sophisticated compressing algorithm that could be applied to the images.
Volumetric Data Visualization
In this section, we’ll take a look at volumetric data visualization datasets and we’ll discuss the advantages and disadvantages of different technologies in volumetric data visualization.
Site-Based Approach
This is the most straightforward solution, which implies the separate visualization of every slice of the volume dataset with an opportunity to scroll them interactively. Further, the simplicity of the implementation and low computational complexity are the key advantages of the technique. However, its main problem is that the viewer should use the imagination to reconstruct an entire object structure.
As a result, the slice-based approach is not the most suitable for visual analyses of very complex and unknown structures. But, it suits the detection of features inside well-known objects, such as parts of the human body. That’s why the methodology is widely used in medicine. For example, it is the most popular way of representation for MRI and CT. It is worth mentioning, that general CT and MRI studies have a much lower resolution in one of the dimensions, which causes some difficulties in utilizing the datasets with more advanced technologies.

Emulation of Other Technologies
This approach can be very useful when visual analyses are performed by experts, who are used to a certain technology. For instance, it can be used during the development of new technologies in medical and seismic areas. Moreover, the emulation allows experts to have a smooth transition from old visualization solutions to more modern techniques. However, the approach is not very popular due to several reasons:
- Firstly, it requires the usage of a very detailed volume dataset. However, a major part of the information would be lost or spoiled by mimicking another technology. For this reason, the popularity of the visualization will steadily decrease during the integration of the new technology into the experts’ workflow.
- Secondly, the development of this volumetric data visualization type requires too much time to archive the results. This would be close to the initial technology’s images and its usage can be dropped at the end of the transition period. An additional problem of the approach is that it requires certain knowledge and experience for the correct result interpretation.
Indirect Volumetric Data Visualization Rendering
Volumetric data visualization of a 3D object as a 2D image is called 3D rendering. The most common way of 3D rendering is based on photo-realistic visualization of surfaces which are represented by polygonal meshes. Notably, the technology is utilized so widely that modern graphic card architecture is designed to accelerate the operation.
As there are many tools for visualizing polygonal mesh models, the idea behind Indirect Volume Rendering is obvious. The approach consists of two steps.
- The first one is an extraction of an isosurface out of a dataset under a certain threshold. Several algorithms exist to perform the task.
- The most popular one is Marching Cubes. Sometimes isosurface extraction can be improved by developing a special algorithm that is based on a specific feature of the dataset. Then the polygonal surface model can be visualized by any 3D engine or other tools for visualization of polygonal mesh models, e.g., LightningChart MeshModels.
Advantages:
As there are many tools for visualizing polygonal mesh models, the idea behind Indirect Volume Rendering is obvious. The approach consists of two steps.
- It contains all the typical features of 3D object visualization such as rotation, usage of different amounts of light sources, interaction with other 3D objects, and so on.
- As a result, it makes complex 3D structure analysis much simpler.
- It is especially useful for the visual detection of meaningful details inside unknown datasets.
- Due to the performance optimization of common 3D rendering engines, the visualization can be handled by any modern office workstation.
- Moreover, the technique allows developers to use much more sophisticated noise reduction algorithms.
Disadvantages:
The disadvantages of the approach are caused by the first step of the visualization process.
- Firstly, conversion of the volume dataset to the polygonal mesh surface leads to the loss of the data from inside the surface area.
- Secondly, the isosurface extraction algorithm can require complex calculations, so preprocessing can take a noticeable amount of time, that’s why usually it is impossible to interactively change the threshold of the surface extraction.
Direct Volumetric Data Visualization Rendering
Direct Volume Rendering does not require any preprocessing. The data is visualized from an original dataset. Further, it gives the algorithms an opportunity to modify the transfer function and threshold dynamically. Also, some of the approaches allow for visualization of the internal structure of the dataset in a semi-transparent way.
Further, it is practically the most powerful way to visualize volume data. The visualization has all the advantages of polygonal mesh models. Therefore, it can be easily combined with them in the same scene. In addition, it is possible to cut a part of the model for an investigation of structures hidden by the object’s surface.
Disadvantages:
- The main disadvantage of the approach was the high hardware requirement. Due to modern graphic card development achievements, it is possible to run the visualization even with cheap options.
- Another problem is the high cost of the volume rendering engine development.
Importantly, there are several different technological implementations of Direct Volume Rendering. The most common ones use the tools created for a GPU acceleration of polygonal mesh models rendering in their way. Above all, texture-based Volume and Volume Ray Casting are presently the most successful approaches to direct volume rendering. Moreover, the texture-based Volume Rendering technic uses a set of plans to construct the object.
The dataset is projected to the planes as textures. The final picture is combined by the alpha blending of the planes. The volume Ray Casting approach uses a cube as a placeholder for the volume model. The model itself is projected to the sides of the cube by the Ray Casting algorithm, which uses rays to accumulate the data and combine it with the specific equation called Ray Function.
Ray Function
Ray Function is a truly fascinating feature of Volume Ray Casting. Therefore, it allows defining how rays perform sampling of the dataset and calculation of the pixel color.
Different Ray Functions can extract different features from the dataset. Let’s discuss three examples of the Ray Function:
- Accumulation Ray Function application visualizing the medical dataset. The accumulation Function tries to collect and combine as much data as possible to give a viewer an opportunity to explore the internal structure of the object. The visualization produced by this technique looks like a semi-transparent gel.
- Maximum Intensity Function application for the ultrasound waves interference simulation. Here, Maximum Intensity Function visualizes only the brightest value sampled by the ray. Visually it provides similar results to the X-ray images. It allows us to get additional information about the internal structure of the object.
- Isosurface Ray Function application for visualization of water flow simulation. As we can see, Isosurface Rendering draws the model surface in a way that looks like polygonal model rendering. The result is very similar to those produced by Indirect Volume Rendering.
Enough of theory, let’s code…
Local Setup
For this project, we need to consider the following requirements to compile the project.
- OS: 32-bit or 64-bit Windows Vista or later, Windows Server 2008 R2 or later.
- DirectX: 9.0c (Shader model 3 and higher) or 11.0 compatible graphics adapter.
- Visual Studio: 2010-2019 for development, not required for deployment.
- Platform .NET Framework: installed version 4.0 or newer.
Now go to the next URL and download LightningChart .NET. You’ll then be redirected to a sign-in form where you’ll have to complete a simple sign-up process to get access to your LightningChart account.
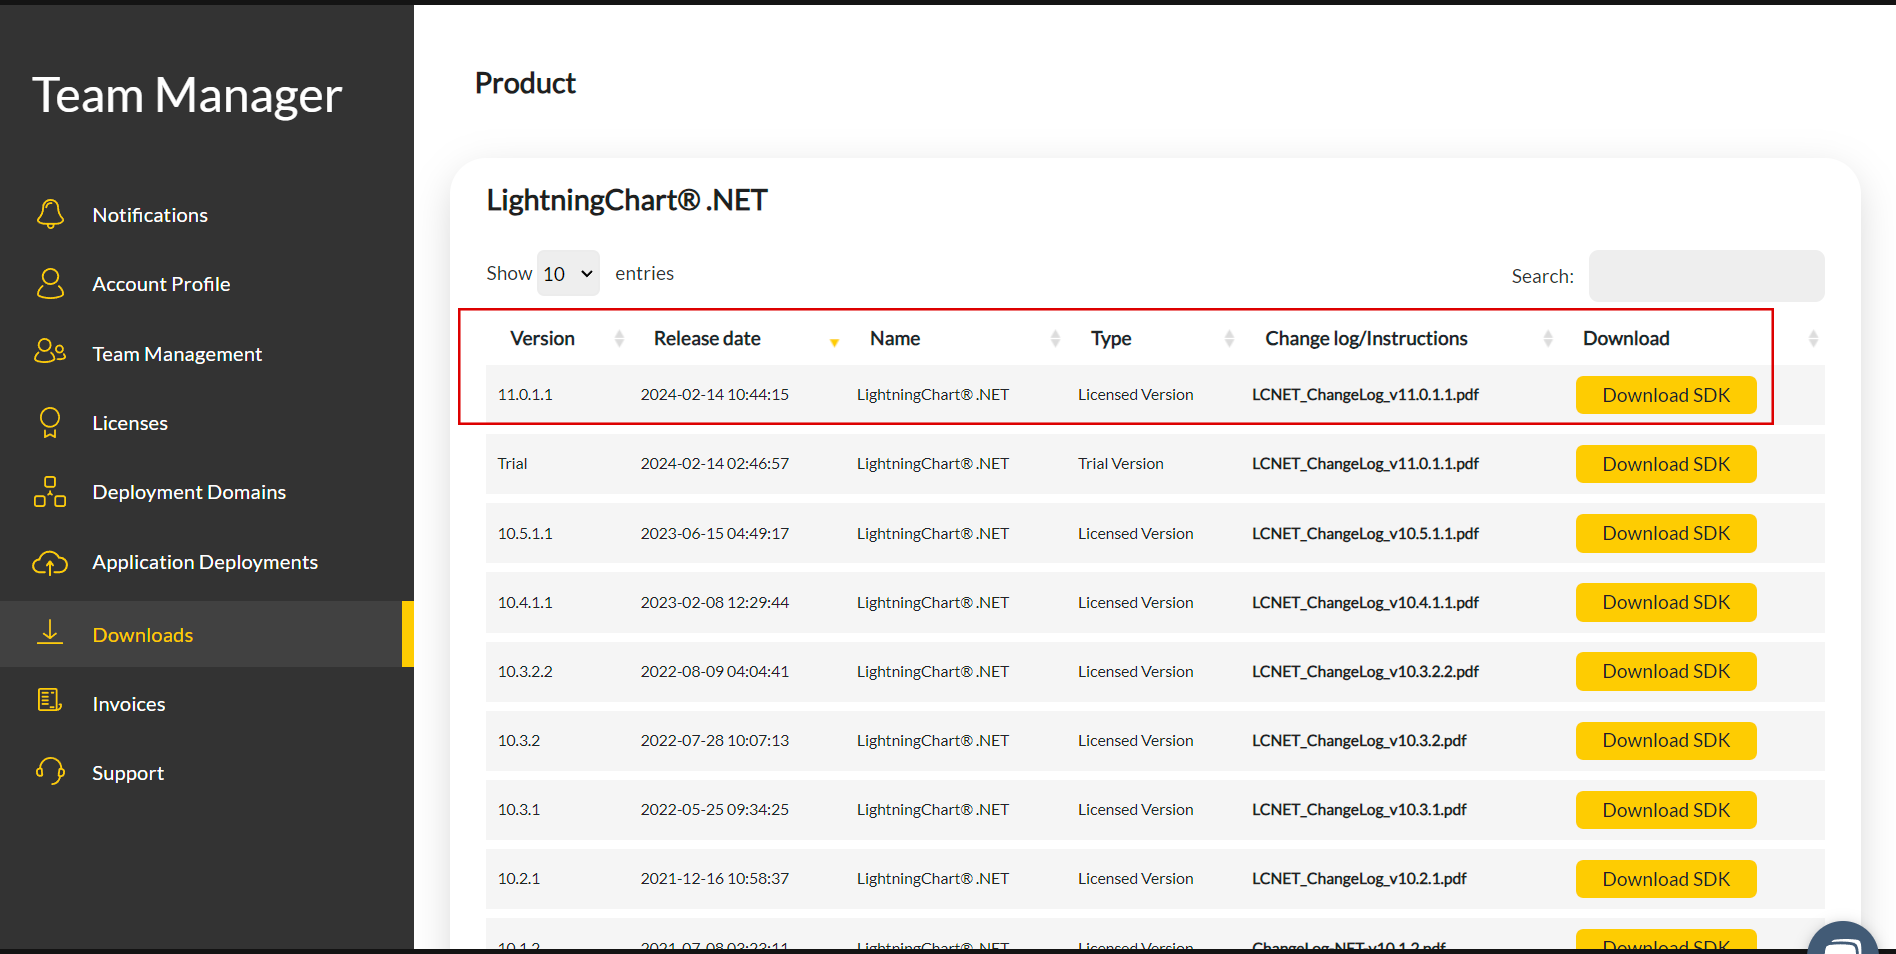
After signing in to your account, you can download the SDK “free trial” version that allows you to use important features for this tutorial. When you download the SDK, you’ll have a .exe file like this:

The installation will be a typical Windows process, so please continue with it until it is finished. After the installation, you will see the following programs:

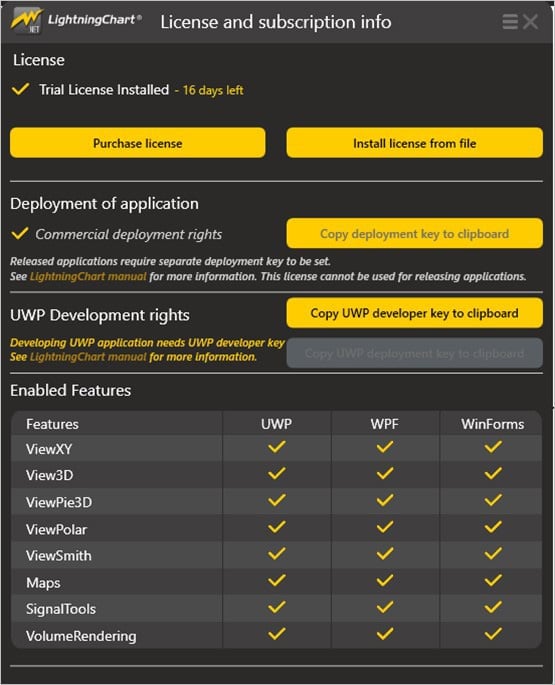
License Manager
In this application, you will see the purchase options. All the projects that you will create with this trial SDK, will be available for future developments with all features enabled.
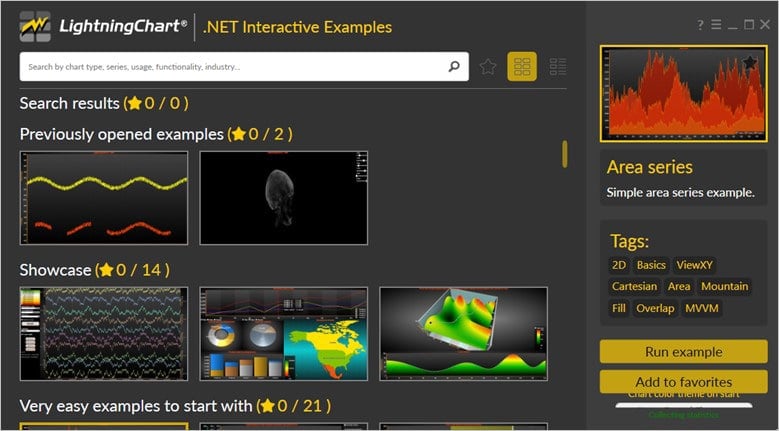
LightningChart .NET Interactive Examples
You can see 100+ interactive visualizations for WPF, WinForms, and/or UWP.
Visual Studio Project
The main difference between the LightningChart visualizer and Visual Studio is that we can analyze and experiment with many features within the source code. In the LC visualizer, select the “volumetric rendered human head” example and run it:

We will use the “head” option. With the “head” example, we will see the animation and other options. In the top-right zone of the windows, you will see the following options:
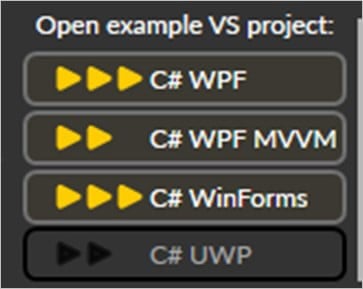
For the trial SDK, we will be able to use the WPF and WinForms frameworks. If you are fully related to Windows forms, this option will be more comfortable. In this case, I will use the Windows Presentation Foundation framework. After clicking the framework to use, we will need to specify a folder where the project will be created:
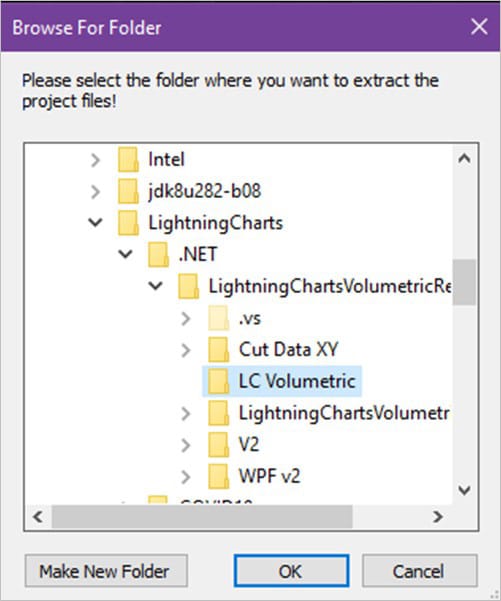
Finally, the project will be created, and Visual Studio will be opened and ready for execution.
Code Review
The main code will be wrapped inside MainWindow.xaml.cs. Here we will find the code for UI controls.
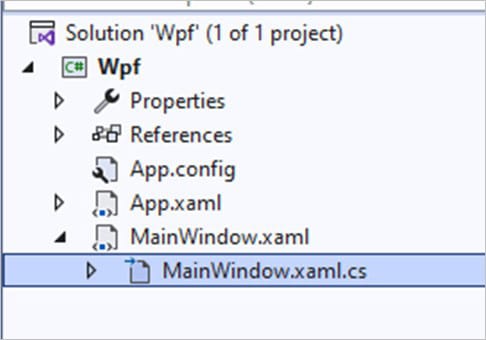
CreateChart()
In the following code line, the folder with all “head” pictures will be loaded. If you put a breakpoint there, you will see a path like this: “C:\ProgramData\Arction\Volume\Head”
//creates volume model and loads the model with slices
_vm = new VolumeModel(_chart, Environment.GetFolderPath(Environment.SpecialFolder.CommonApplicationData) + "\\Arction\\Volume" + "\\Head");
If you see, all the pictures are like frames that are part of a bigger image. You can replace all images with a similar sequence and experiment with all properties for rendering. “You can replace this collection with the “body” example”.

_Code Object
Now let’s work with Visual Studio. The main difference between using the LC visualizer and Visual Studio is that we will be able to analyze and experiment with many features in the source code. In the LC visualizer, write inside the filter “Volumetric”… a sub-menu will be displayed:
private LightningChart _chart;Inside CreateChart(), we will see many properties configured to the object _chart. This object will be our “canvas”, where the image will be displayed. This object would be equal to the chart object created in our previous TypeScript projects.
//Set active view
_chart.ActiveView = ActiveView.View3D;

//Chart name
_chart.ChartName = "Volume chart";

//Chart background color
_chart.ChartBackground. GradientColor = Colors.Black;
_chart.ChartBackground.Color = Colors.Black;

//Camera settings
_chart.View3D.Camera.MinimumViewDistance = 100;
_chart.View3D.Camera.ViewDistance = 150;
_chart.View3D.Camera.Target.X = 10;
_chart.View3D.Camera.Target.Y = 0;

//Lights setting
_chart.View3D.Lights[0].AttenuationLinear = 0.007;
_chart.View3D.Lights[0].AttenuationQuadratic = 0.00005;
_chart.View3D.Lights[0].DiffuseColor = Colors.DimGray:
_chart.View3D.Lights[0].SpecularColor = Colors.Gray;
_chart.View3D.Lights[0].Location.SetValues (50, 100, 0);
_chart.View3D.Lights[0].LocationFromCamera = false;- Active view: Depending on the chart type, a specific view will be needed. In this case, we must use the 3D view. LC has the following views:
- ViewXY
- View 3D
- ViewPie3D
- ViewPolar
- ViewSmith
- VolumeModels.Add: After specifying our type of chart (View3D), we need to add the volume model(Image to be displayed). In this case, the model has been encapsulated in the _vm object. With the Add function, we will be able to assign the model to our 3D chart.
//add volume model to the chart
_chart.View3D.VolumeModels.Add(_vm);

//Allow chart rendering
_chart.EndUpdate();- EndUpdate: Every property or series data value change will cause the LightningChart control to be redrawn. Every redraw will cause CPU and display adapter overhead.
- If more than one property is programmatically changed at the same time, the property changes should be made between BeginUpdate() and EndUpdate() method calls, as a batch. BeginUpdate() will stop drawing the control until EndUpdate() is called.
- There is an internal counter for pending BeginUpdate() calls, and when an equal amount of EndUpdate() calls have been reached, EndUpdate() redraws the control.
_Vm Object
The_vm object will construct our volumetric model, using the VolumeModel property.
private VolumeModel _vm;Volume Model
Is a tool for volume data visualization via Direct Volume Rendering. VolumeModel takes the volume data inside and visualizes it.
- LightningChart’s volume rendering engine is based on Volume Ray Casting.
- An image is produced by the algorithm via the volume data sampling along the tracks of the rays that travel inside the dataset.
- A simple realization of hardware acceleration for Volume Ray Casting requires generating boundaries for a volume object.
- Usually, they are represented by a cube. High rendering quality without artifacts and usage of the interchangeable ray function are the main advantages of this technology.
Loading Data
There are several ways how the data can be imported into the VolumeModel:
- Data can be supplied to the Data property as a collection of images that represent slices of the dataset
- Data can be supplied directly to the constructor of the VolumeModel in various ways
- Data can be supplied to the VolumeModel via one of the load functions
Properties
//set parent chart
_vm.SetChart(_chart);

//position and setting of volume model
_vm.Size.Depth = 100;
_vm.Size.Height = 75;
_vm.Size.Width = 100;
_vm.Rotation.X = 270;
_vm.Rotation.Z = 180;

//set sampling
_vm.SamplingRateOptions.TargetFPS = 15;
_vm.SamplingRateOptions.SamplingRateRange.Min = 384;
_vm.SamplingRateOptions.SamplingRateRange.Min = 768;
_vm.Smoothness = 2;

//set threashold to cut away skin and soft tissues
_vm.Threshold.Min = new PointRGB(0.5f, 0.5f, 0.5f);

//cut away the part of dataset which is out of the area of interest
_vm.SliceRange.Max.X = 0.7f;
_vm.SliceRange.Max.Y = 0.8f;
_vm.SliceRange.Min.X = 0.3f;
_vm.SliceRange.Min.Y = 0.2f;- SliceRange: this property allows cutting away a part of the VolumeModel. It is a very useful tool for the exploration of the object’s internal structure. SliceRange contains two boundaries, Min and Max, both of which are represented by three pointing float values.
- SamplingRateOptions: contains several options for SamplingRateManager. SamplingRateManager is needed to reach the optimal balance between quality and frame rate for the hardware.
- By default, SamplingRateManager is turned on by the property Enabled being set true. If set false, the ManualSamplingRate value will be used.
- SamplingRateRange defines the boundaries for SamplingRateManager.
- Threshold: the Volume Rendering Engine can apply a threshold range by a property to the VolumeModel. There is a separate boundary for every color channel. The voxel is visualized only if the corresponding color values are lower than the high boundary and higher than the low boundary at all the channels. The accepted areas are invisible. This property is not taken into consideration by the mouse hit test.
- Size: in 3D world dimensions (not X, Y, or Z-axis values) as Width and Height. Set the center point via Center property, defined in X, Y, and Z-axis values.
- Rotation: property specifies the rotation of the render in degrees.
Conclusion
In conclusion, the development of hardware prepares the base for the growth of interest in different volume data acquisition technologies. Improvements in consumer computer performance will have a positive effect on the popularity of advanced volume visualization techniques, such as Direct and Indirect Volume Rendering, while more basic ones will become less popular.
Volumetric data visualization is a powerful tool for understanding and analyzing complex data sets. While it requires sophisticated software to produce high-performance volumetric applications, the results can be extremely informative and insightful. With the right tools and approach, volumetric data visualization can help you make better decisions, faster.
LightningChart is an outstanding tool for the implementation of Slice-based and Indirect Volume-rendering visualizations of volume data. Some of LightningChart .NET volumetric rendering charts include the coloring volume model that demonstrates how a stack of 2D matrices could be converted into a colored VolumeModel. Medical industry-oriented models include a volumetric rendering of a human head and a thorax.
LightningChart Data Visualization Solutions are advanced data visualization libraries for .NET and JavaScript featuring 200+ charts that can be easily integrated into cross-platform applications that demand high-performance charts with fast rendering and large dataset processing of several billion and even trillion data points.

