Build the most powerful trading & financial apps with LightningChart® JS Trader
Revolutionary, lightning-fast & high-precision chart suite for creating next-gen financial & trading applications
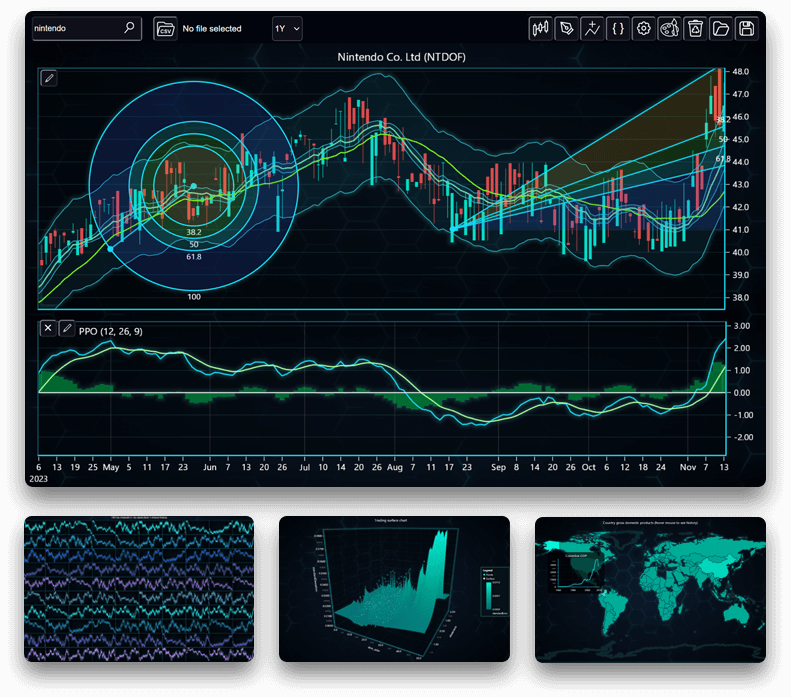
Technical Analysis Charts
LightningChart® JS Trader features advanced technical chart types including CandleStick, Bar charts, Line charts, Mountain, Kagi, Renko, Point & Figure, and Heikin-Ashi price charts. Develop industry-leading applications with our 100+ Technical indicators including Envelopes, Moving Averages, Oscillators, Statistics, Trend Indicators, Volatility, and more. Drawing Tools (30+) include Fibonacci, Trend Lines, Patterns, Channels, Measurement, Text, Shapes, and more.
2D, 3D, and Real-Time Charts
Develop next-level and rich Fintech applications integrating high-performance and real-time 2D & 3D charting controls including XY charts, candle-stick charts, bar charts, line charts, mountain charts, business charts, geographical charts, heatmaps, 3D Surface charts, 3D bar charts, 3D line series, scatter charts and several more. The real-time charts enable smooth visualization of 4000+ charts simultaneously with a high data rate.
DataGrid Control
Create high-performance financial and trading applications integrating the DataGrid control for a detailed data visualization in tabular format. DataGrid can be used as a standalone or as an additional control, and it enables rich data analytics views via cell merging, spark charts, dynamic coloring, and customizable UI features.
GeoMaps
Take your financial and trading applications development to the next level by integrating geographical maps in the UI’s you build. The maps enable dynamic colorization by the data value, within each geographical region. Bring global trading and trends more tangible with this high-performance geo map control.
Customizable Charts
Technical Analysis Charts is an extensively customizable control, having several UI themes and UI settings, enabling programmatic interface to interact with objects and save the chart indicators layout as a template. Versatile 2D and 3D charts enable creating custom charts, and enable programmatically connecting the market data feeds to any 2D or 3D charts, and monitoring the market data in real-time, without having to suffer from lags or choppiness of UI updates.
World-Leading Performance
LightningChart® JS Trader is a top-performing fintech-oriented library, leveraging proprietary LightningChart® technology. The charts have the full rendering power of LightningChart, enabling billions of data points to be shown in the charts, and being over 1.5 million times faster in real-time streaming use cases than average charting control. See more on performance facts.
See all charting features
| Charting Features | Basic | Plus | Ultimate | |
|---|---|---|---|---|
| Technical Analysis charts | Color themes | 5 | 5 | 5 |
| Zooming and panning | ||||
| Indicators to choose from | 100+ | 100+ | 100+ | |
| Indicator max count in chart | 5 | Unlimited | Unlimited | |
| Max indicator pane count below price chart | 1 | 10 | 10 | |
| Drawing tools | 33 | 33 | 33 | |
| Zoomband chart | - | |||
| Heatmaps | - | |||
| Symbol comparison | - | |||
| Relative scale | - | |||
| Symbol watermark | - | |||
| Data Grid | Data grid with Spark charts | - | ||
| Versatile charts | Annotations | - | ||
| Markers | - | |||
| Line charts | - | |||
| Scatter charts | - | |||
| Mountain charts | - | |||
| Heatmap charts | - | |||
| OHLC bar charts | - | |||
| OHLC candle-stick charts | - | |||
| Histogram bar charts | - | - | ||
| Pie charts | - | - | ||
| Donut charts | - | - | ||
| Funnel charts | - | - | ||
| Pyramid charts | - | - | ||
| Geo map charts | - | - | ||
| Gauge charts | - | - | ||
| Bubble charts | - | - | ||
| Polar line charts | - | - | ||
| Polar area charts | - | - | ||
| Polar heatmap charts | - | - | ||
| Polar scatter charts | - | - | ||
| Spider charts | - | - | ||
| 3D line charts | - | - | ||
| 3D surface charts | - | - | ||
| 3D bar charts | - | - | ||
| 3D scatter charts | - | - | ||
| 3D meshmodels | - | - | ||
| Real-time charting | Scrolling real-time line charts | - | - | |
| Scrolling real-time mountain charts | - | - | ||
| Scrolling real-time heatmap charts | - | - | ||
| Scrolling real-time 3D surface charts | - | - | ||
Get started with LightningChart JS Trader
Talk to our specialists in a video meeting and access to a limited-time demo web project.
Frequently Asked Questions
What is LightningChart® JS Trader?
LightningChart JS Trader is a powerful charting library designed specifically for trading and financial applications. It offers a suite of lightning-fast and high-precision charts to create next-gen financial tools and platforms.
What are the benefits of using LightningChart® JS Trader?
- Advanced Charting: Create various technical analysis charts, integrate 100+ technical indicators, and utilize over 30 drawing tools for in-depth market analysis.
- Real-time Performance: Visualize massive datasets (4000+ charts) smoothly with minimal lag, ideal for real-time trading scenarios.
- Versatile Charting Options: Develop 2D, 3D, and interactive charts to cater to different analytical needs.
- DataGrid Integration: Enhance data visualization with a high-performance DataGrid for detailed tabular data exploration.
- Geolocation Integration: Add a global perspective to your applications by incorporating geographical maps with dynamic data visualization.
- Highly Customizable: Tailor the charts to your needs with various UI themes, programmatic control, and the ability to save chart layouts as templates.
- Unmatched Performance: Leverage LightningChart® technology for exceptional rendering speed, handling billions of data points efficiently.
What types of technical analysis charts are available in LightningChart® JS Trader?
LightningChart® JS Trader includes advanced technical chart types such as CandleStick, Bar charts, Line charts, Mountain, Kagi, Renko, Point & Figure, and Heikin-Ashi price charts. It also offers over 100 technical indicators like Envelopes, Moving Averages, Oscillators, Trend Indicators, and more.
What sets LightningChart® JS Trader apart in terms of performance?
LightningChart® JS Trader is known for its world-leading performance, leveraging proprietary LightningChart technology. It can handle billions of data points efficiently and is over 1.5 million times faster in real-time streaming compared to average charting controls, ensuring smooth visualization even with large datasets.
How does LightningChart JS Trader achieve its performance advantages?
LightningChart JS Trader leverages the GPU to handle complex computations, freeing up the CPU for other tasks. This allows it to display large datasets smoothly and maintain a 60 FPS refresh rate.
How can I add data to the charts?
LightningChart JS Trader allows you to add data in two ways:
- Adding data in code: It’s very easy to add data through code; all you need is one line of code. You can provide an array of data points, read for example from your data provider, containing Open, High, Low, Close, and dateTime (optional Volume and Open Interest) fields. The chart expects data points to be in chronological order.
- Reading data from CSV files: The chart can read data from CSV files containing specific formatting requirements. The file should include headers like Date, Open, High, Low, and Close (Volume and Open Interest are optional).
What are templates in LightningChart JS Trader, and how can developers utilize them?
Templates in LightningChart JS Trader allow developers to save chart layouts as json-based text files (.txt format) for later use. Templates include settings such as chart type, cursor settings, color settings, added technical indicators, and drawing tools. However, templates do not include stock trading data or heatmaps.
What are the dependencies and telemetry considerations for LightningChart JS Trader?
Templates in LightningChart JS Trader allow developers to save chart layouts as json-based text files (.txt format) for later use. Templates include settings such as chart type, cursor settings, color settings, added technical indicators, and drawing tools. However, templates do not include stock trading data or heatmaps.
Does LightningChart JS Trader integrate with existing financial software projects?
Yes, LightningChart JS Trader is designed to be flexible and can be integrated into various financial software development projects seamlessly.
How does LightningChart JS Trader ensure data security in financial software?
While data security is ultimately the customer’s responsibility as a developer, LightningChart JS Trader provides a robust foundation by focusing on secure coding practices and not storing sensitive financial data within the library itself.