Beginner’s Guide to LightningChart .NET
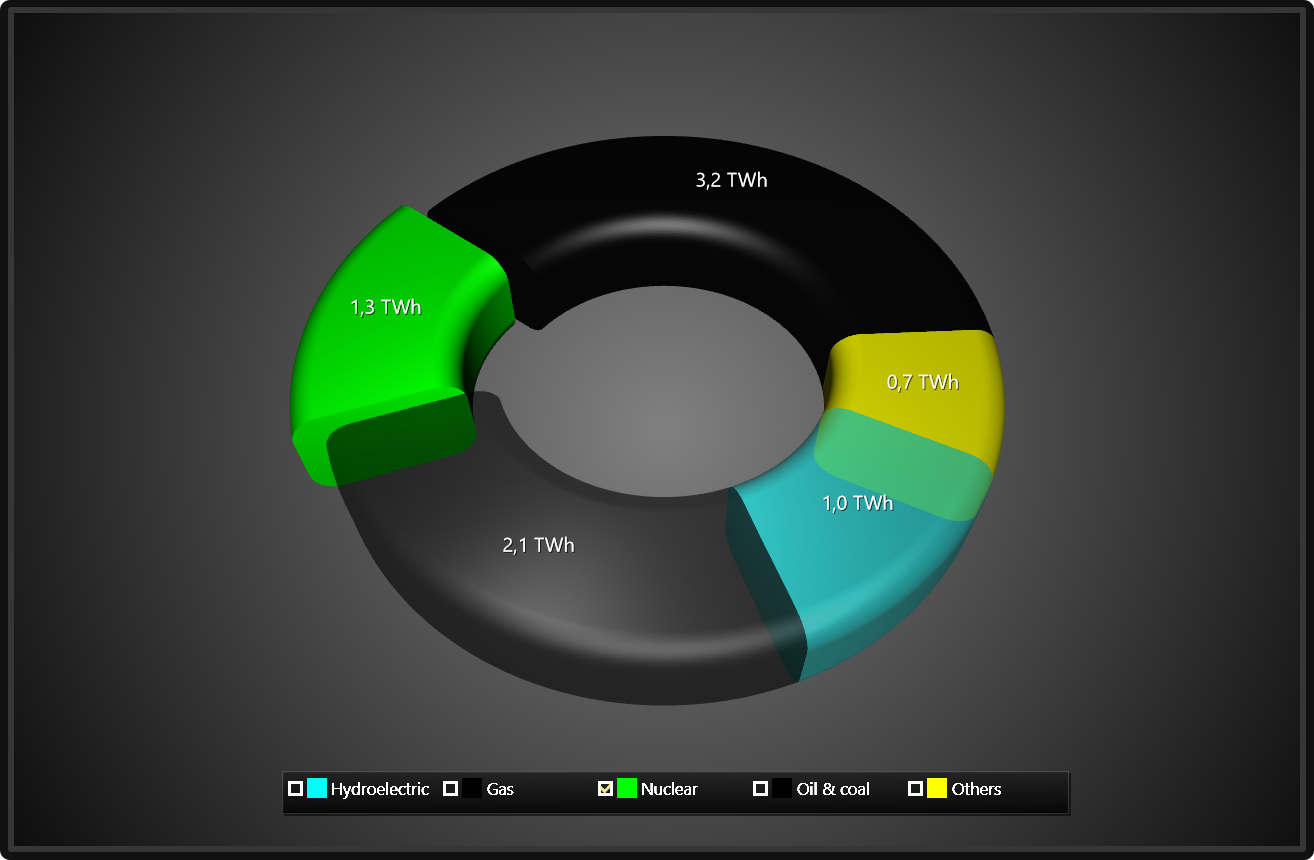
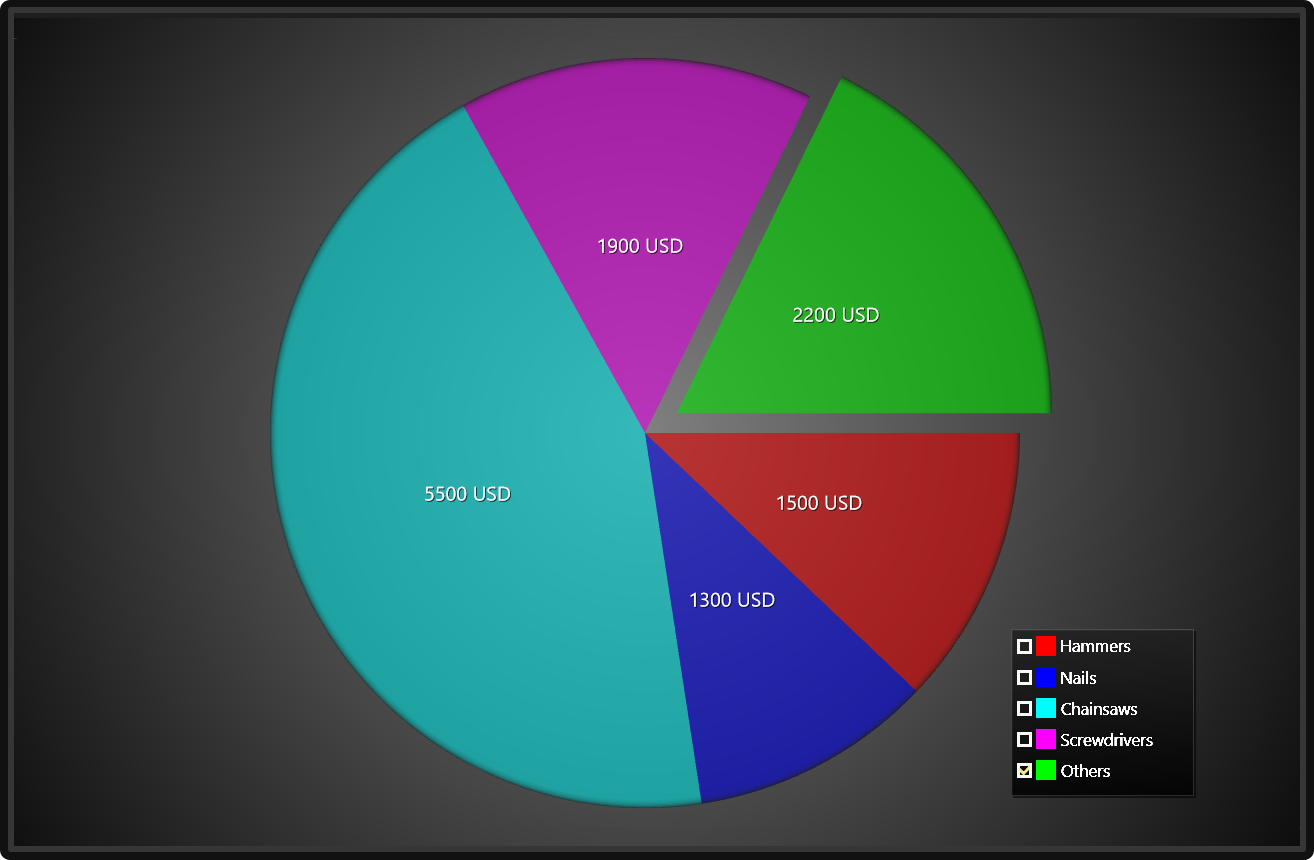
This page shows different Views (ViewXY, View3D, ViewPolar, ViewSmith and ViewPie3D) and essential series types in them. With them you can get a better glance of what series types to use in your application.
Please refer to User’s manual and Demo applications for more details.
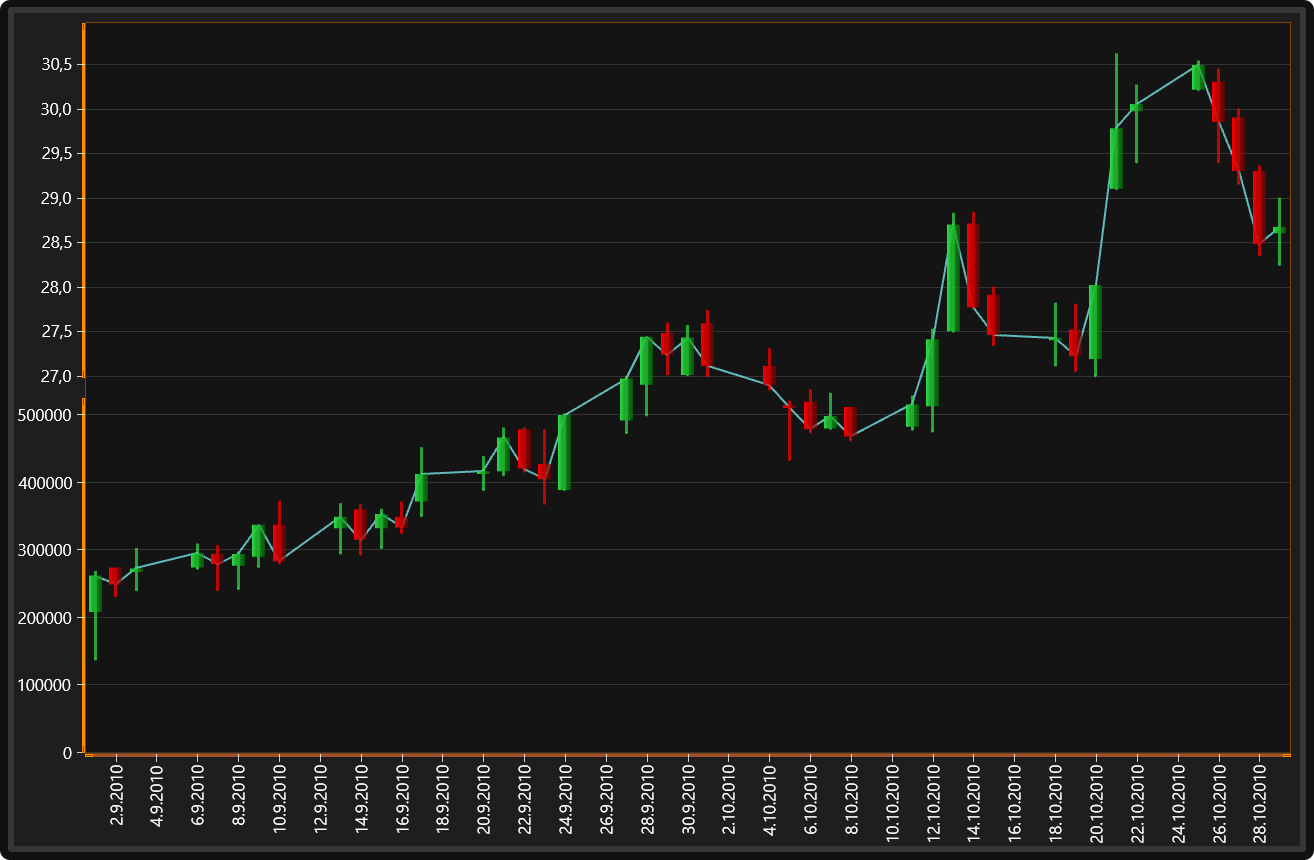
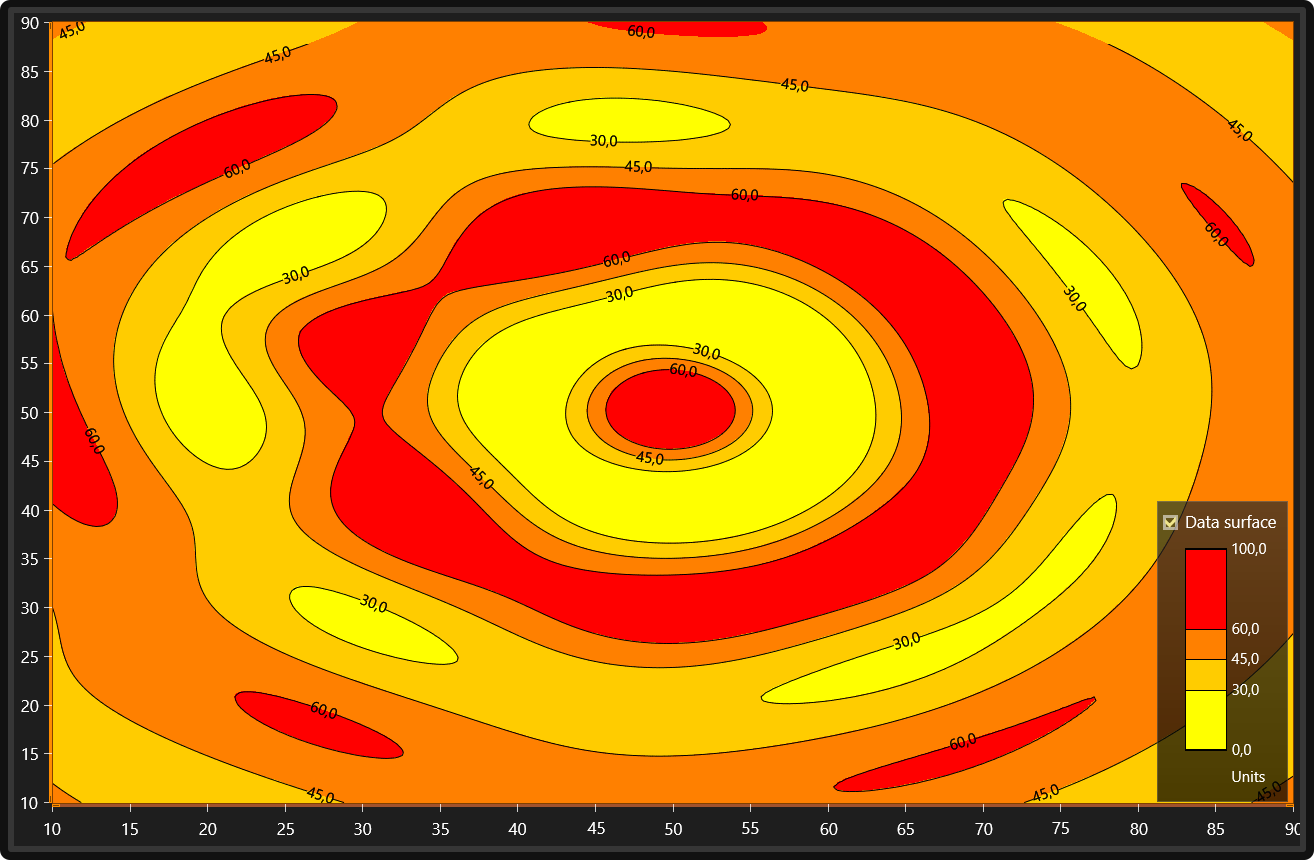
Basic graph area and axes of an XY chart is presented on the left.
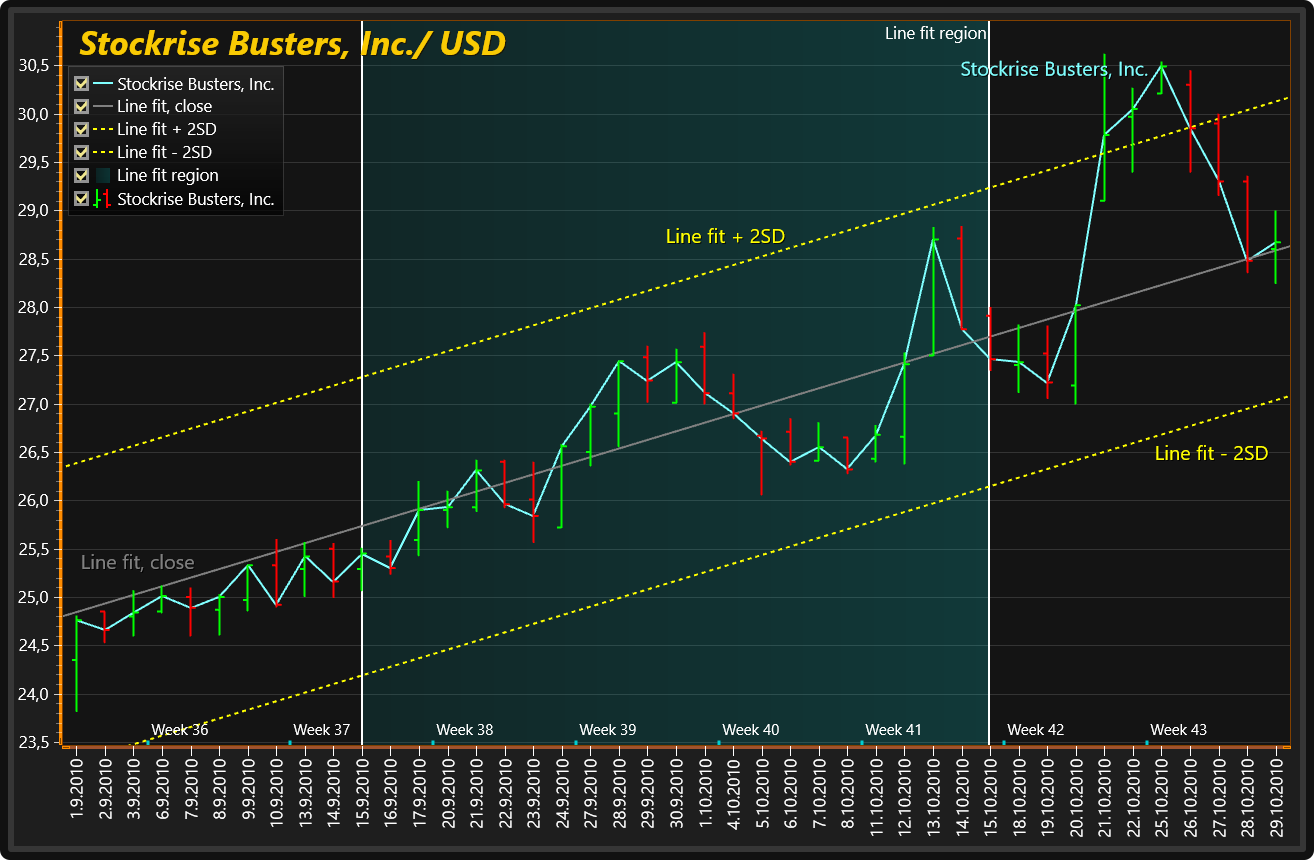
PointLineSeries
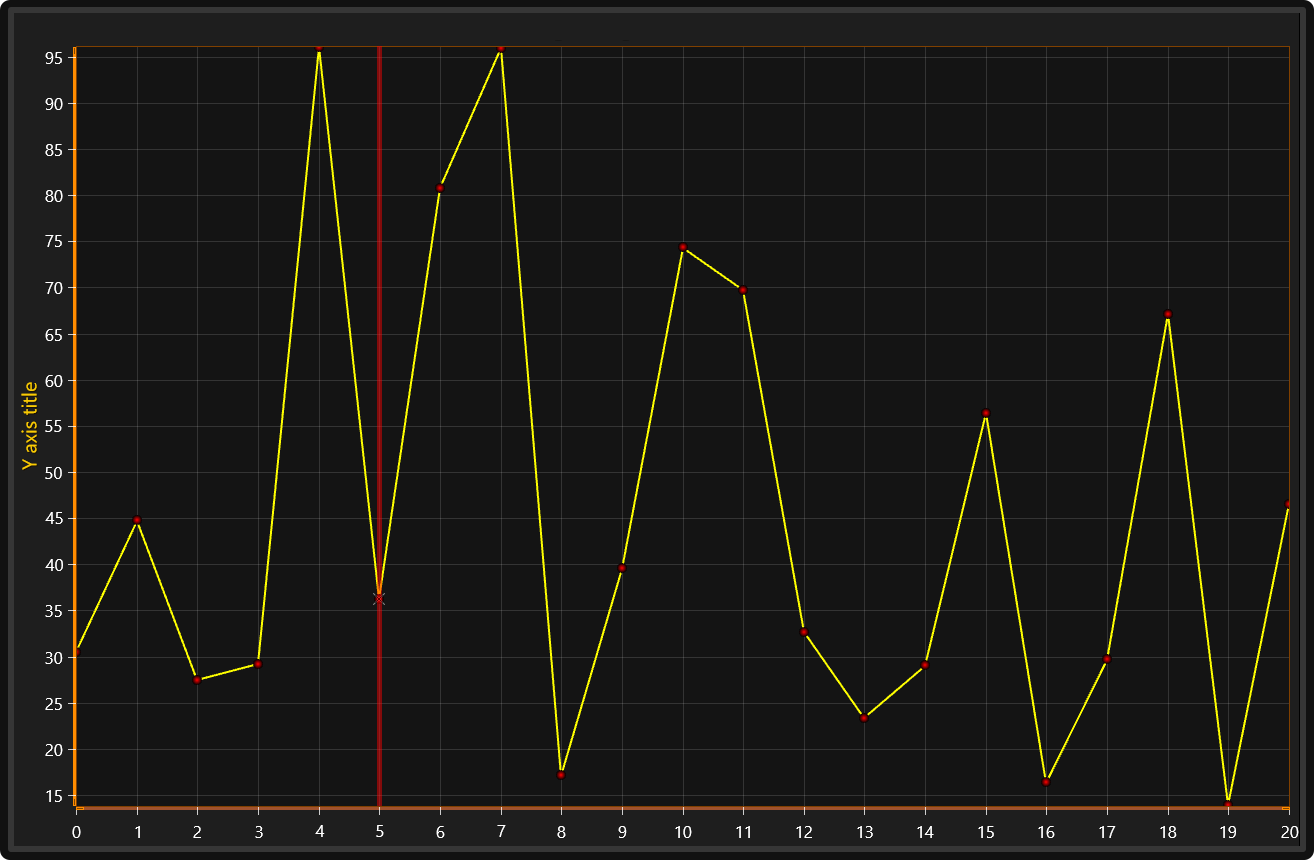

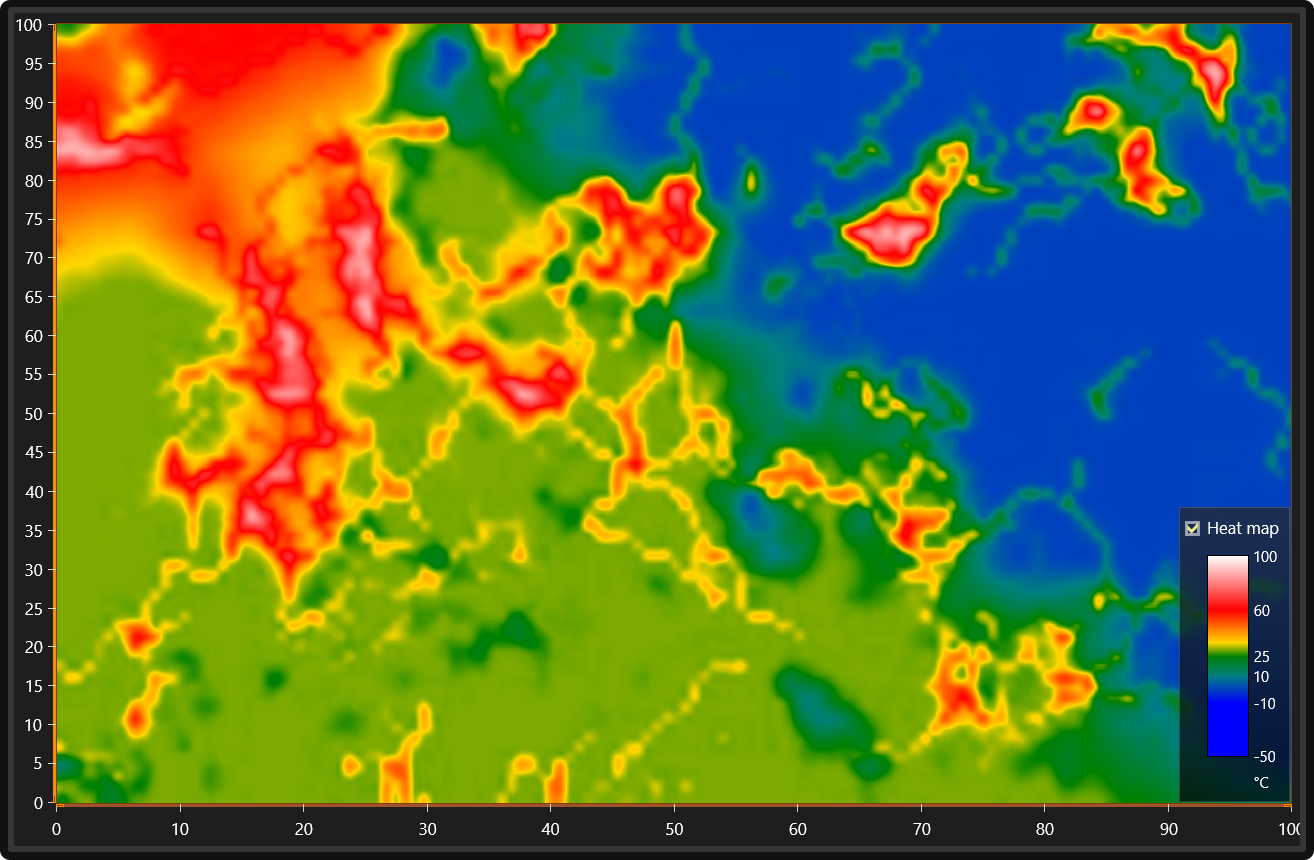
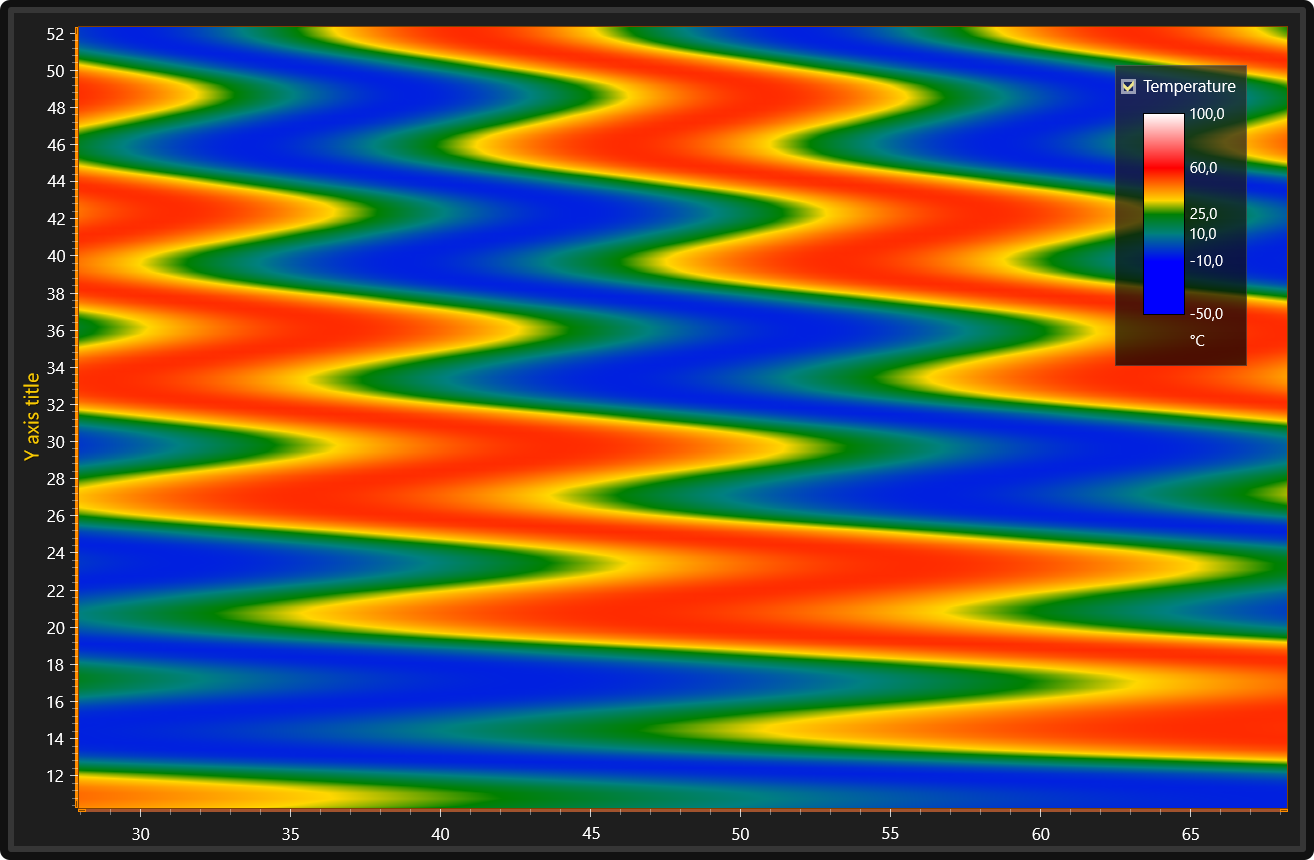
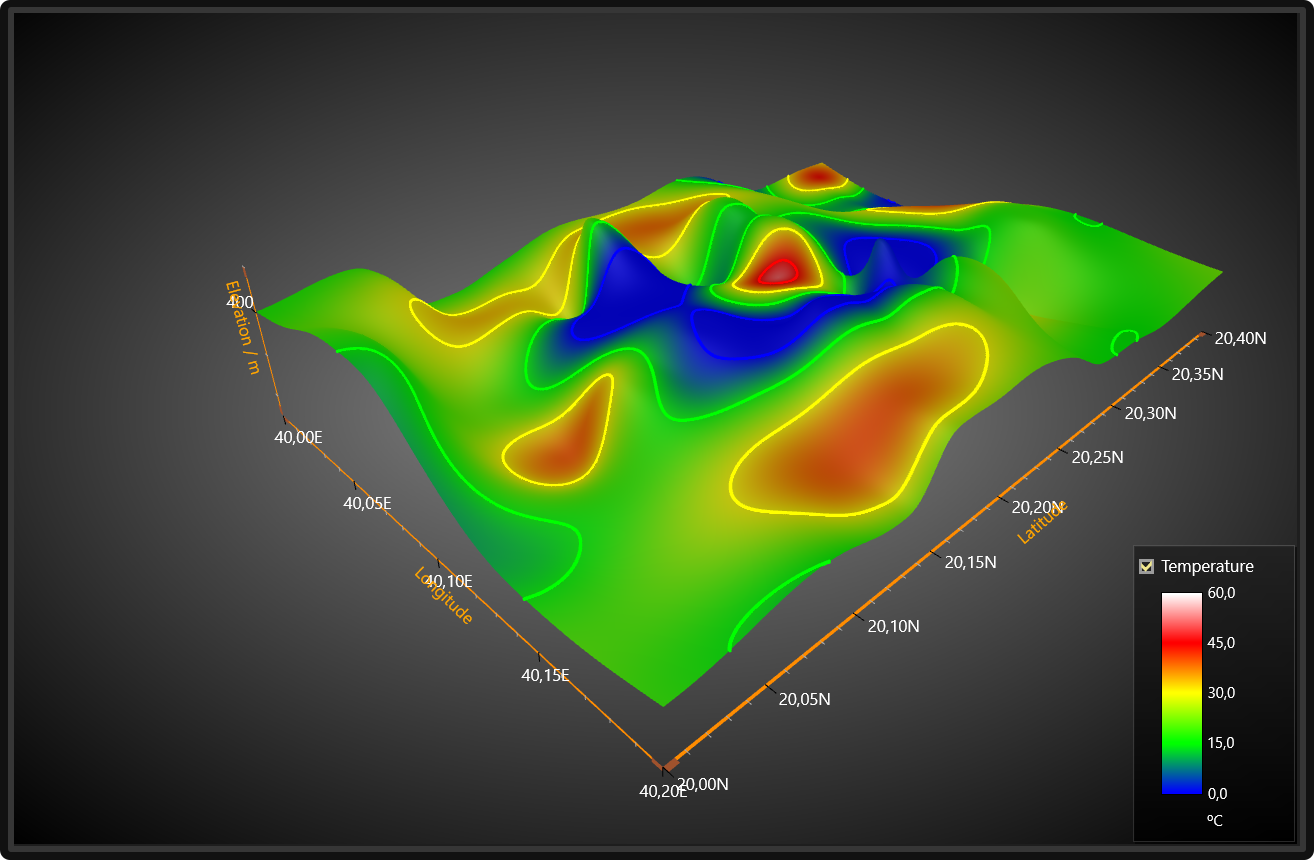
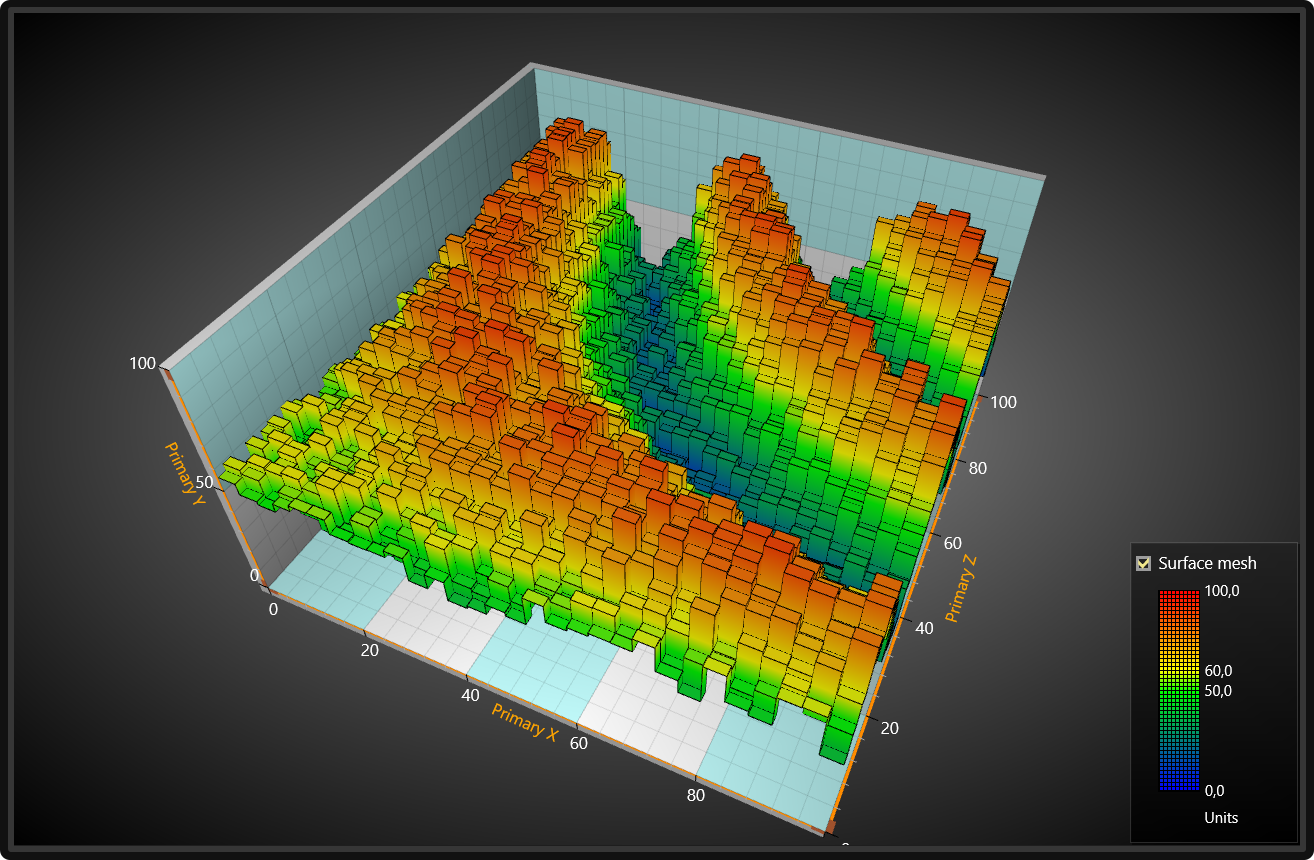
PixelRendering property enables the nodes to be rendered as pixels, or rectangles (the upper-right figure). This allows a very high-performance rendering useful e.g. for real-time high-resolution thermal imaging applications.

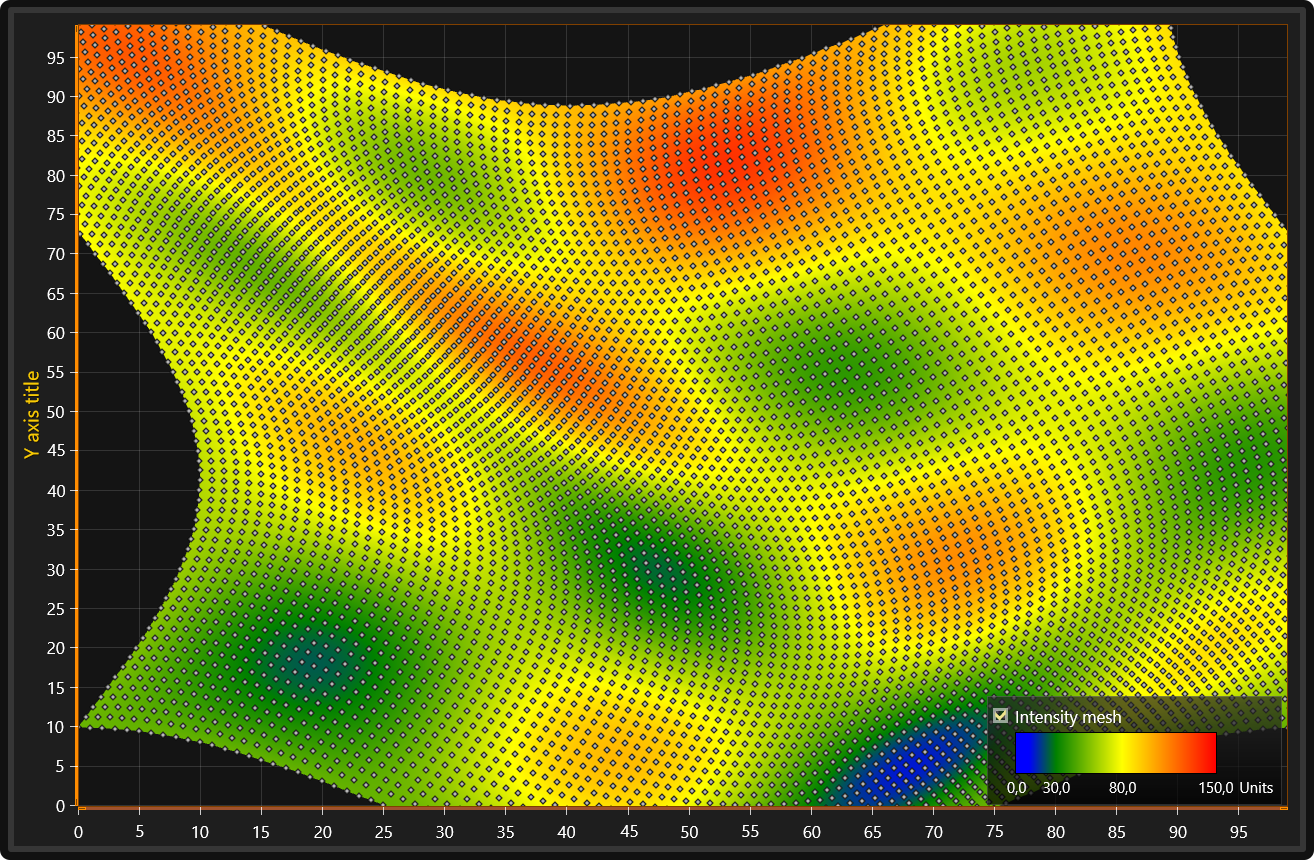
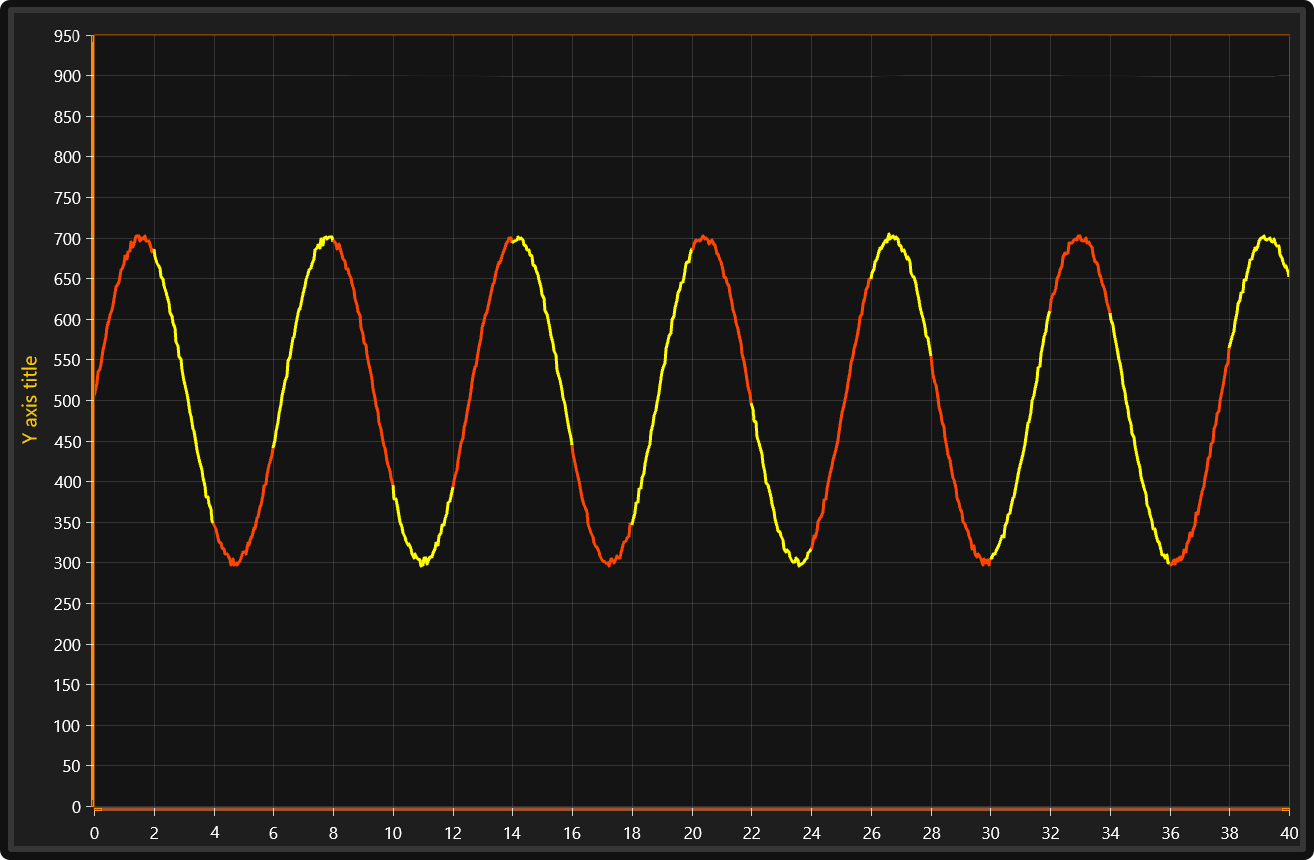
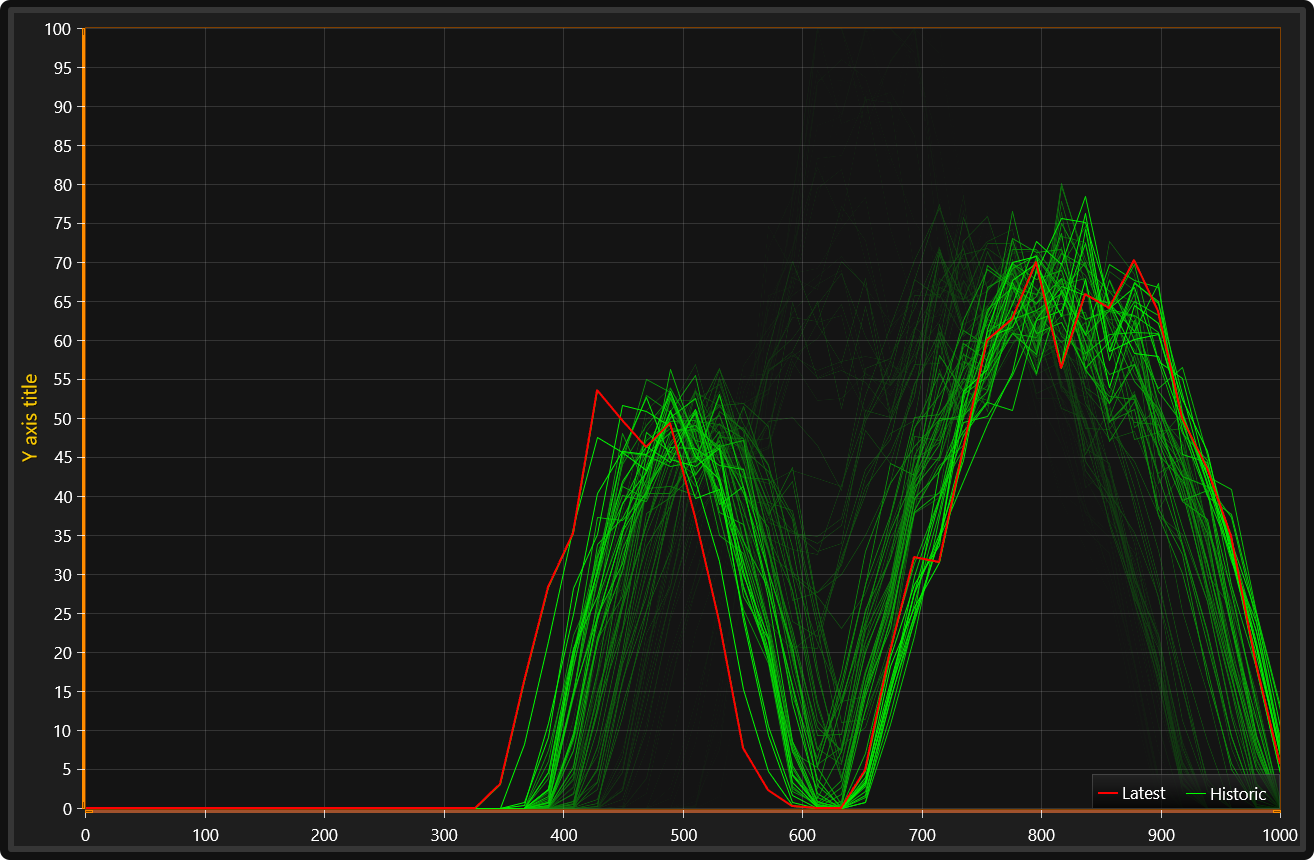
PersistentSeriesRenderingLayer can be used for extremely fast rendering of repetitive data, that is plotted in same X and Y range over and over again.
PersistentSeriesRenderLayer is kind of a bitmap, that allows adding rendering data incrementally in it. It keeps the graphics until cleared by command, or decayed gradually to history.
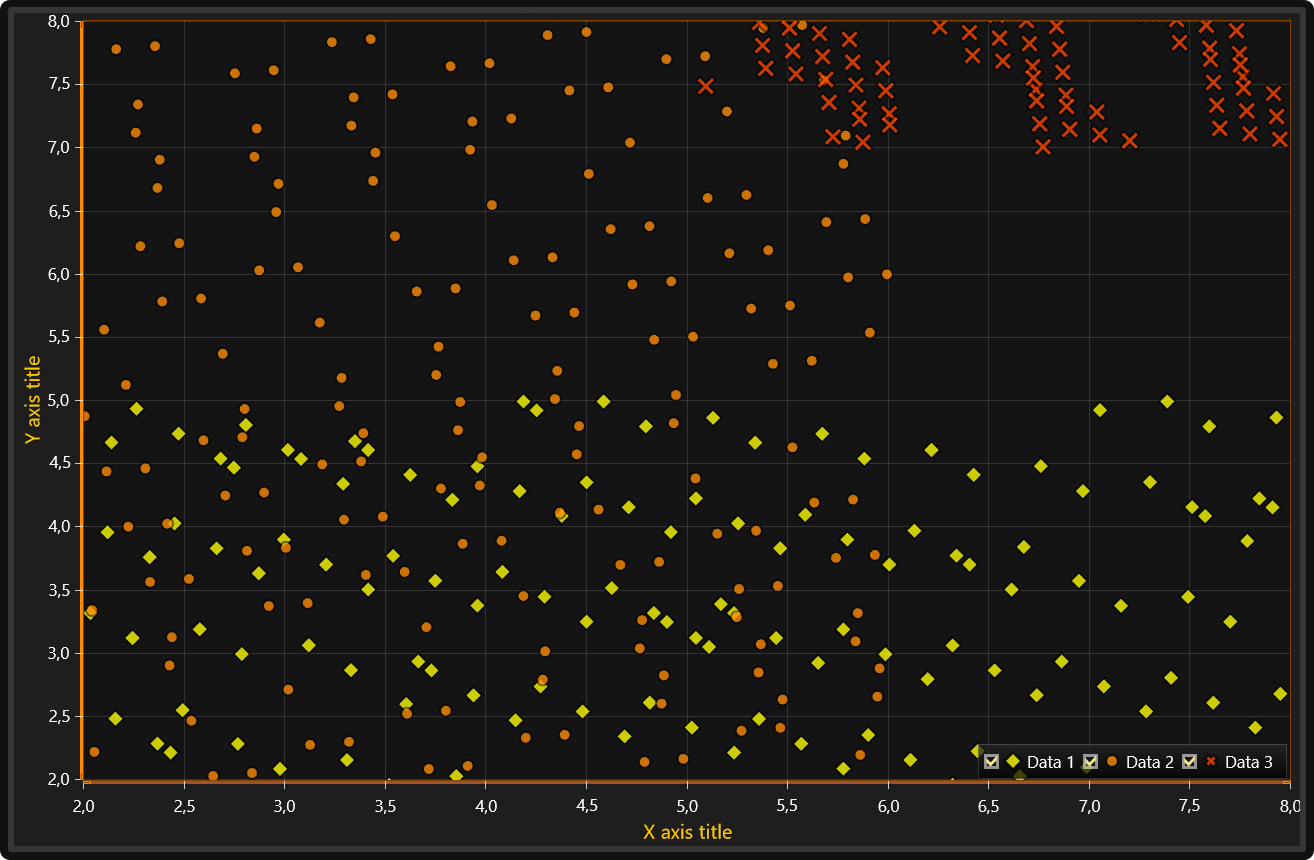
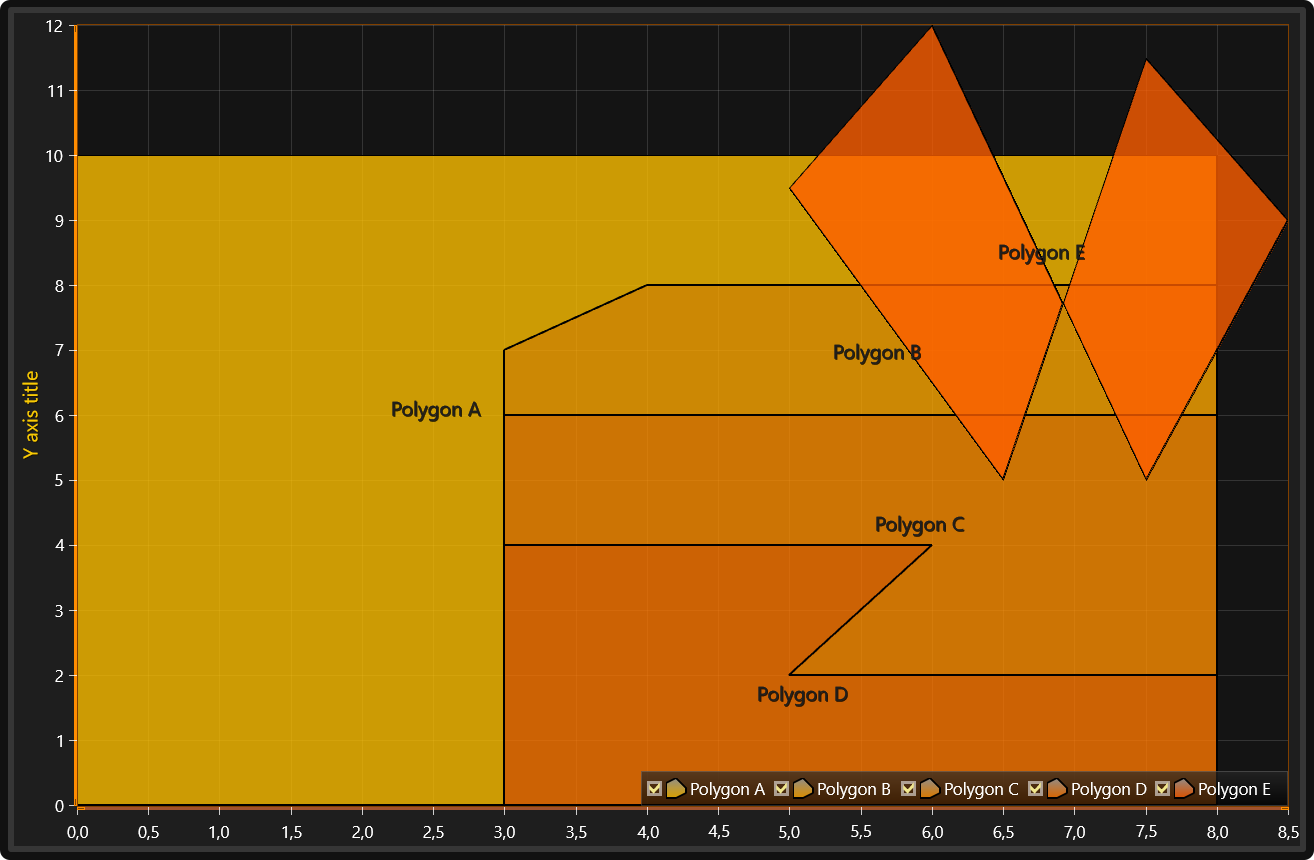
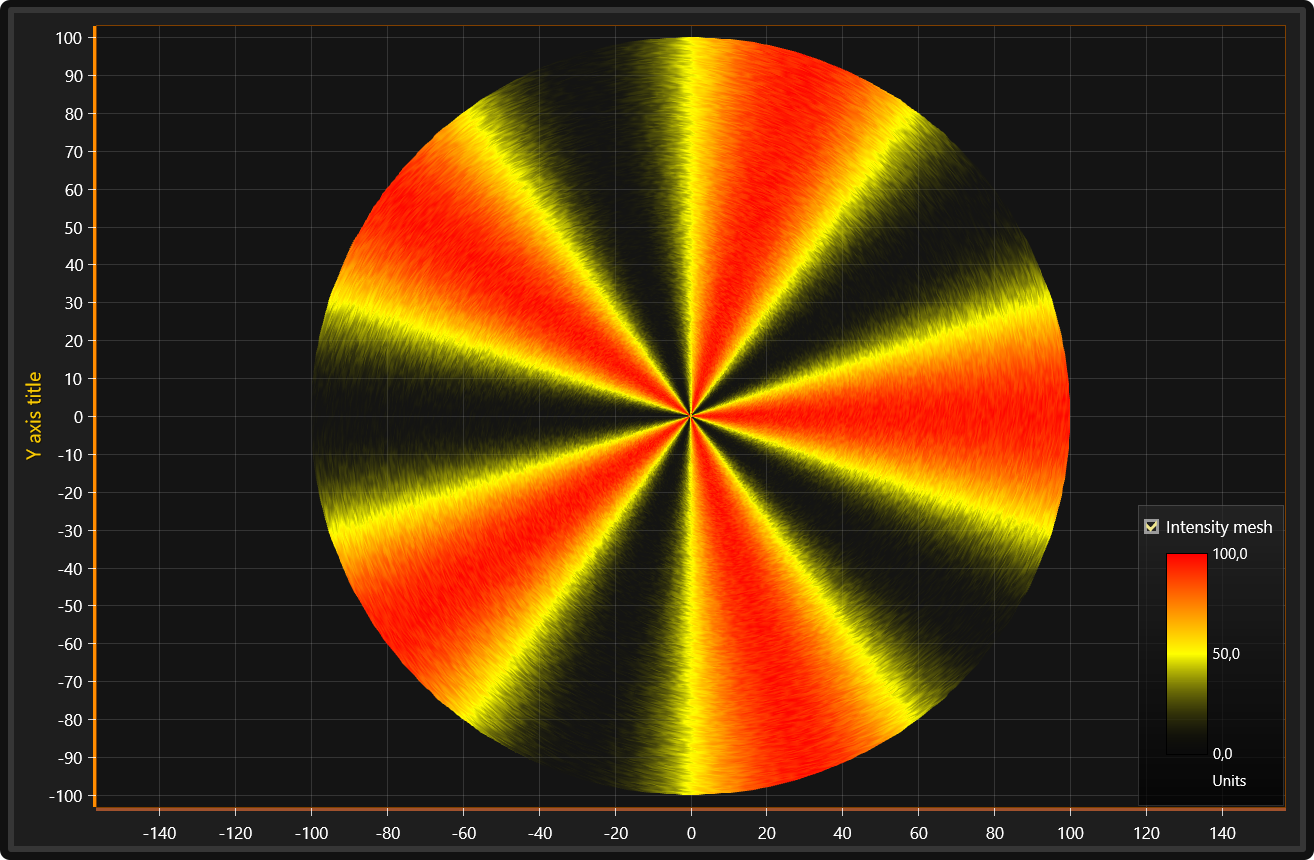
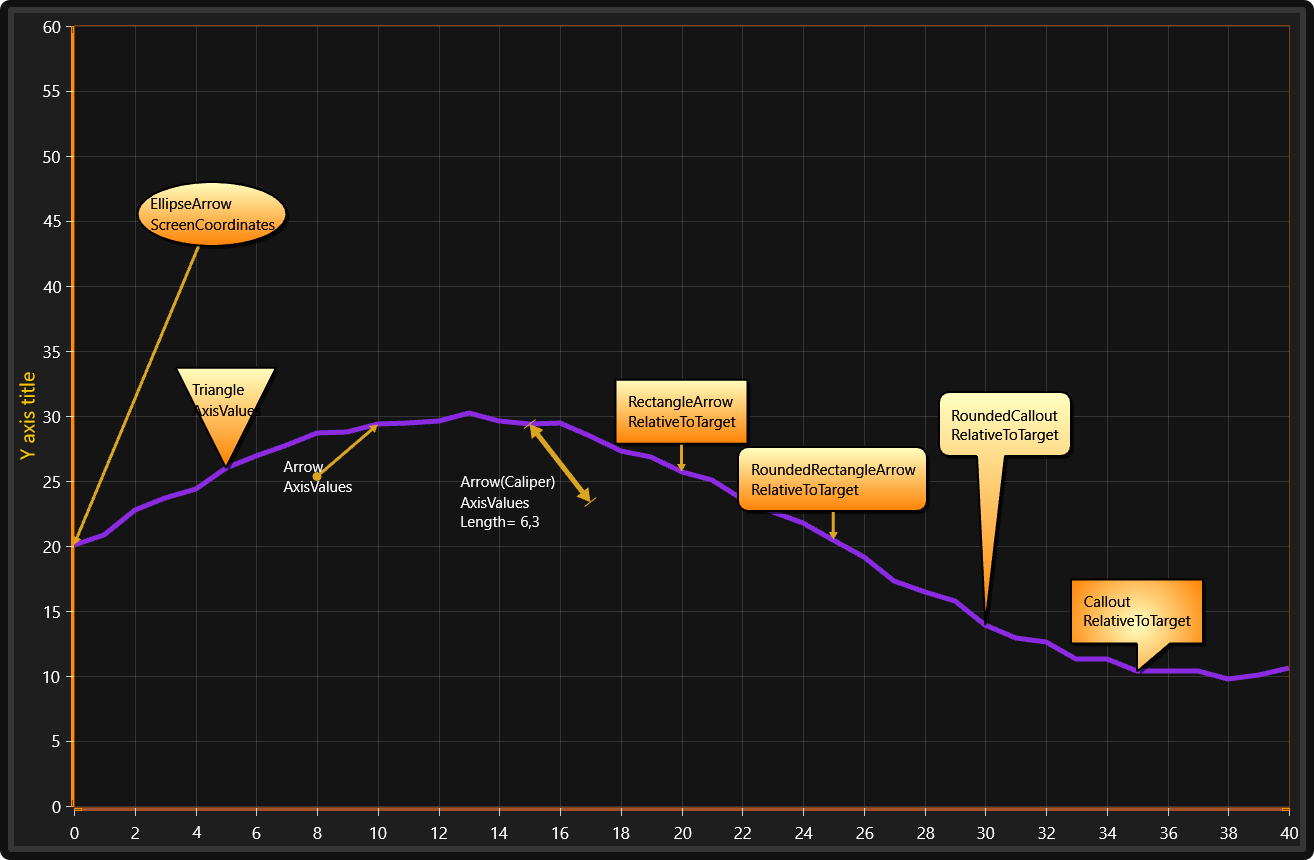
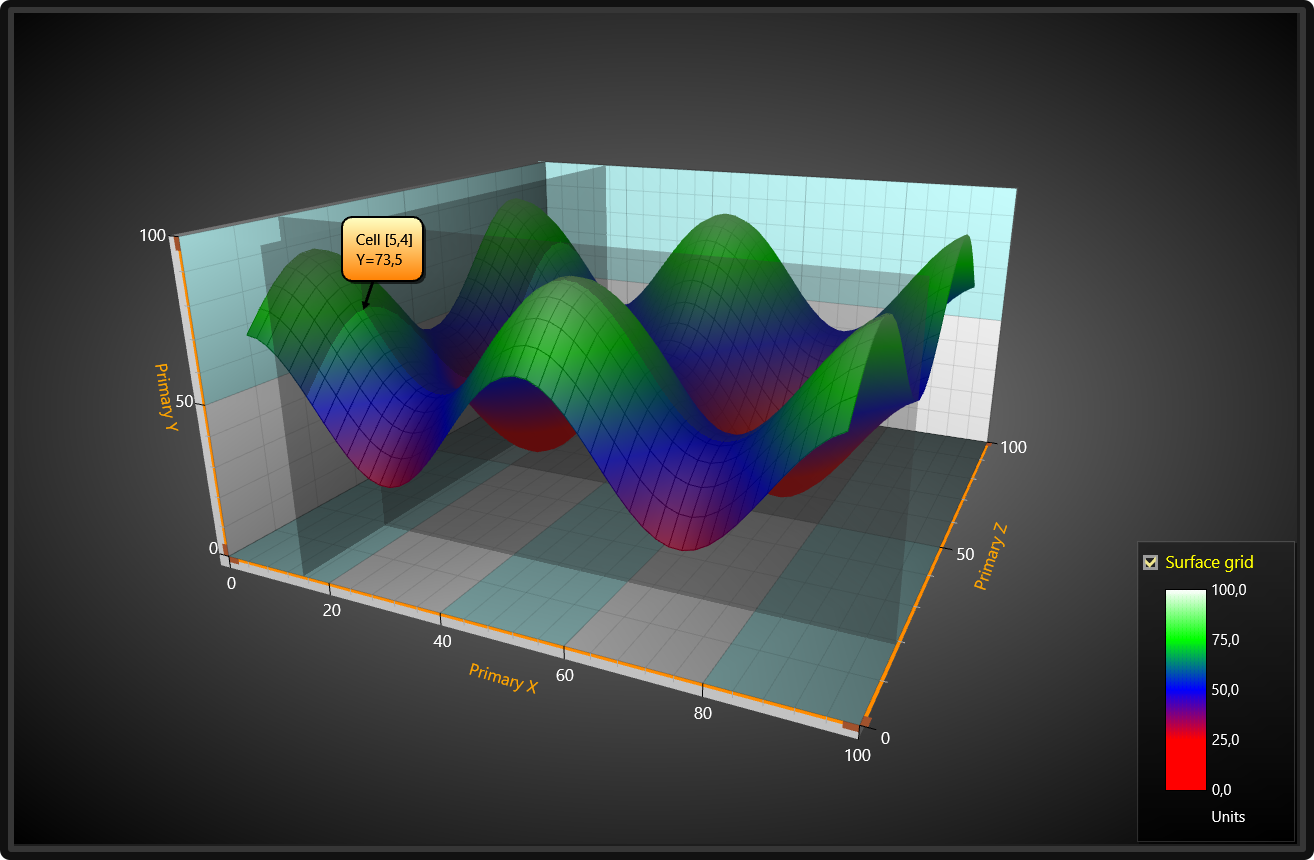
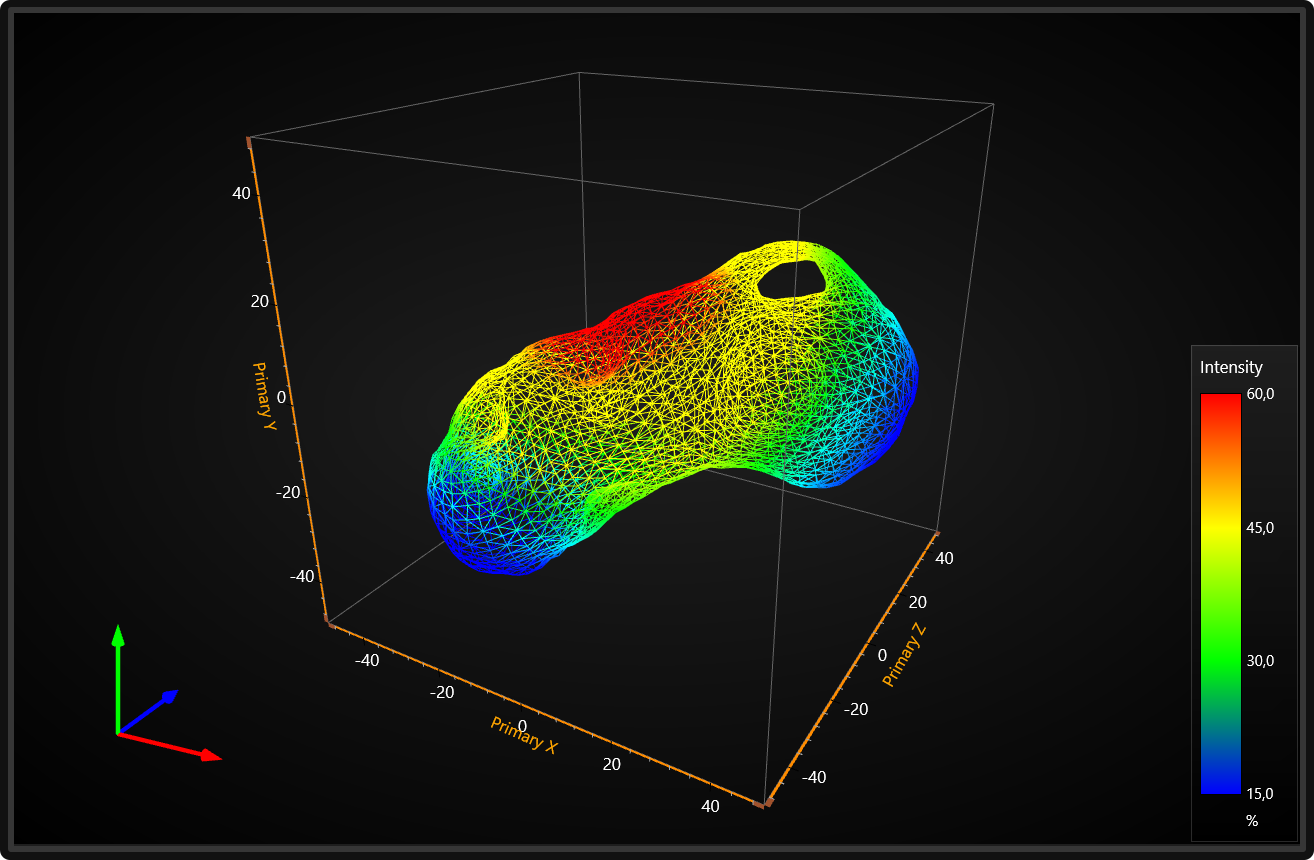
The annotations can also be used when custom graphics must be rendered on the screen, as they can be rendered in different styles and shapes.
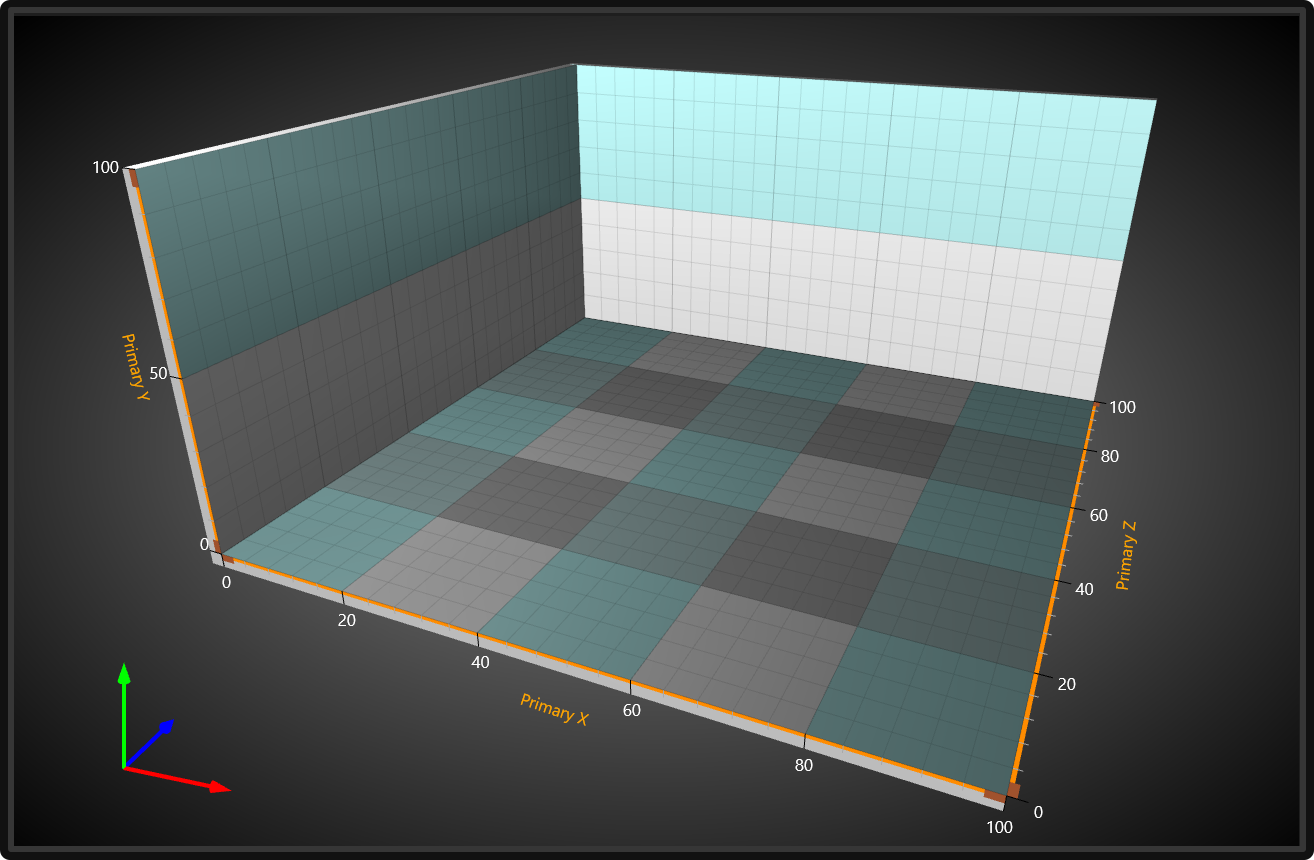
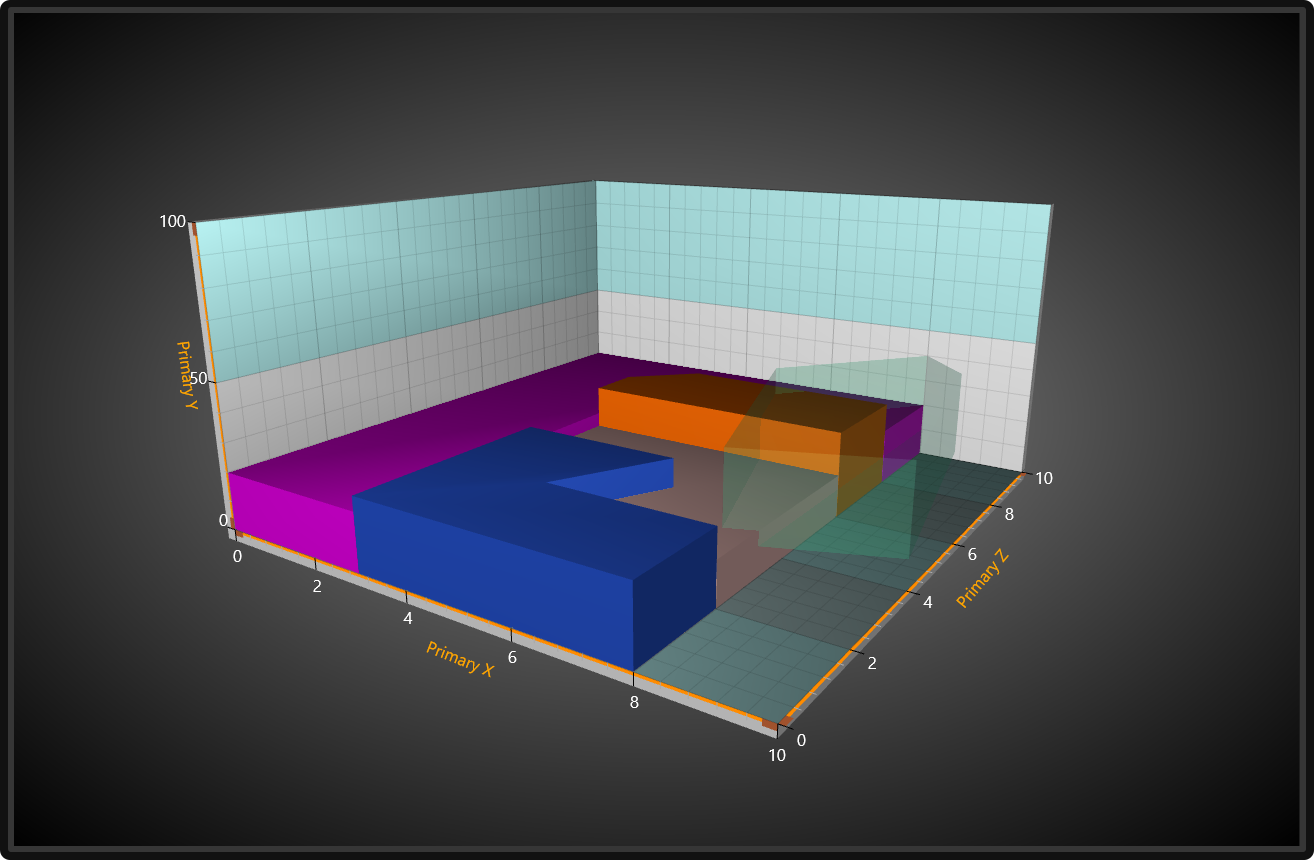
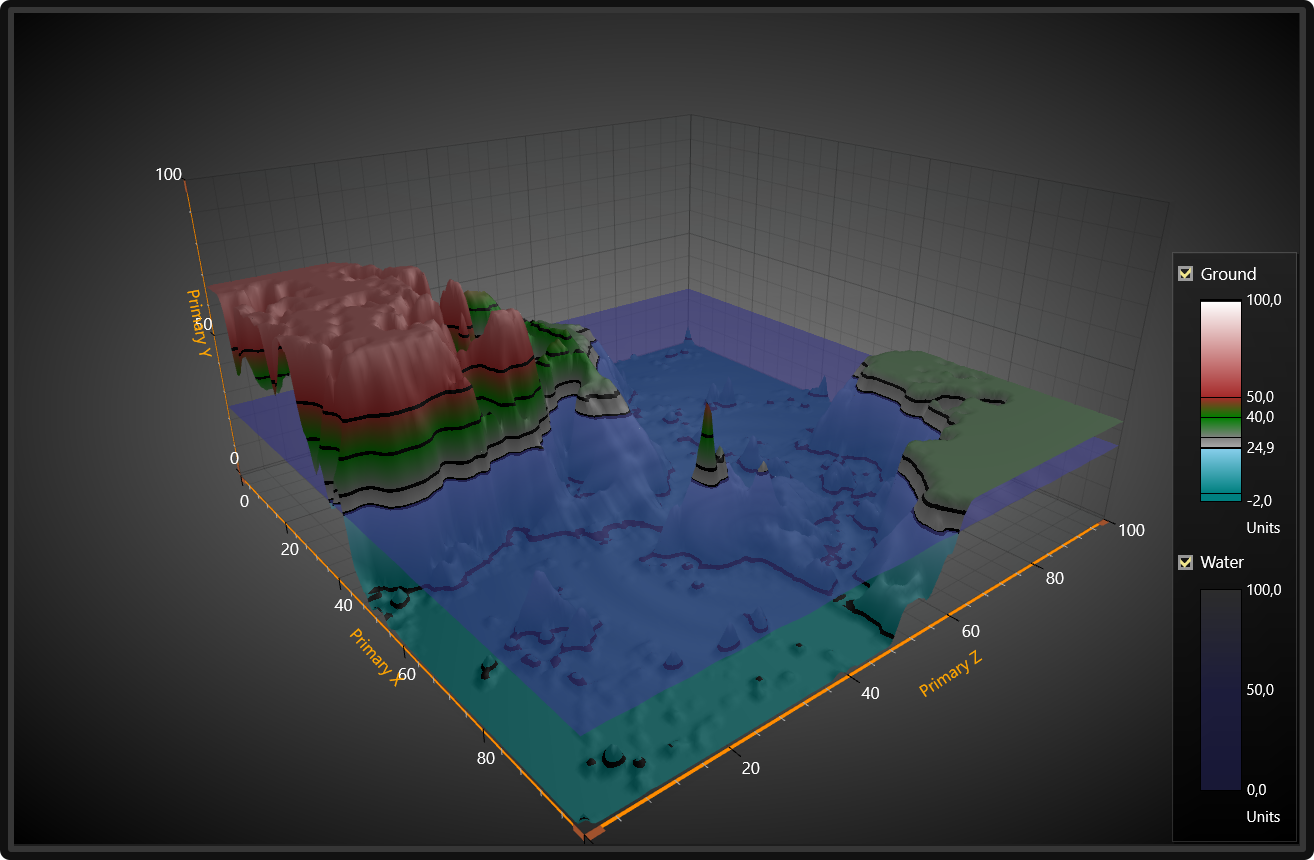
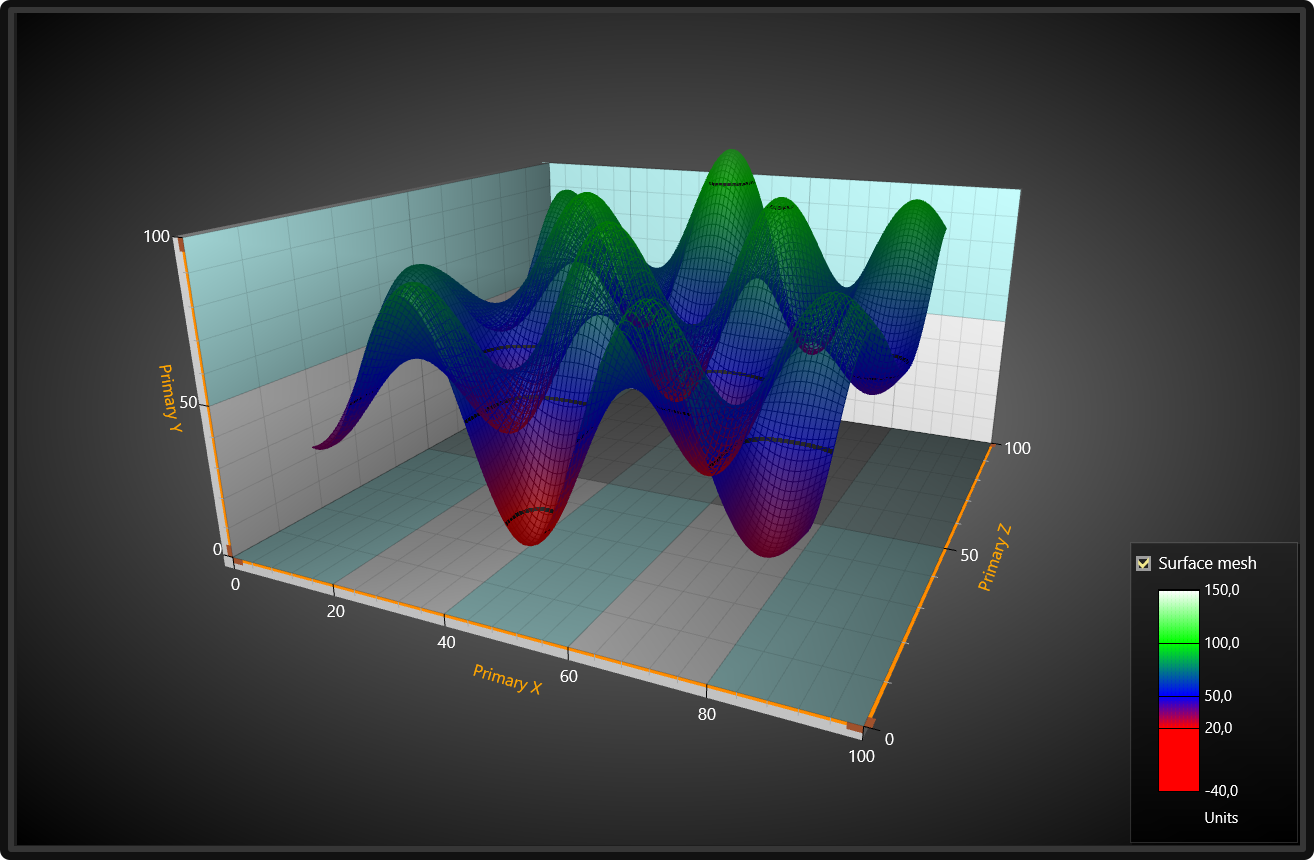
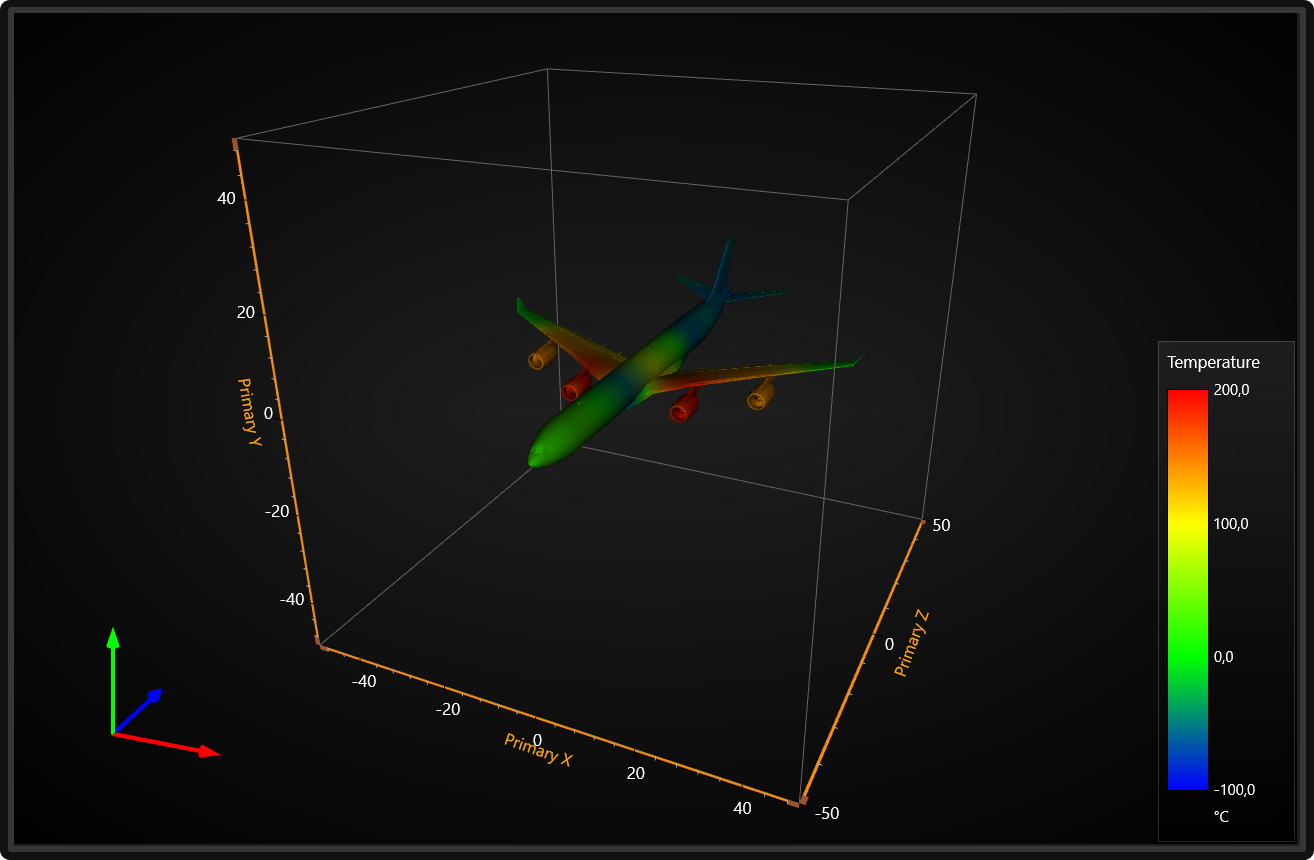
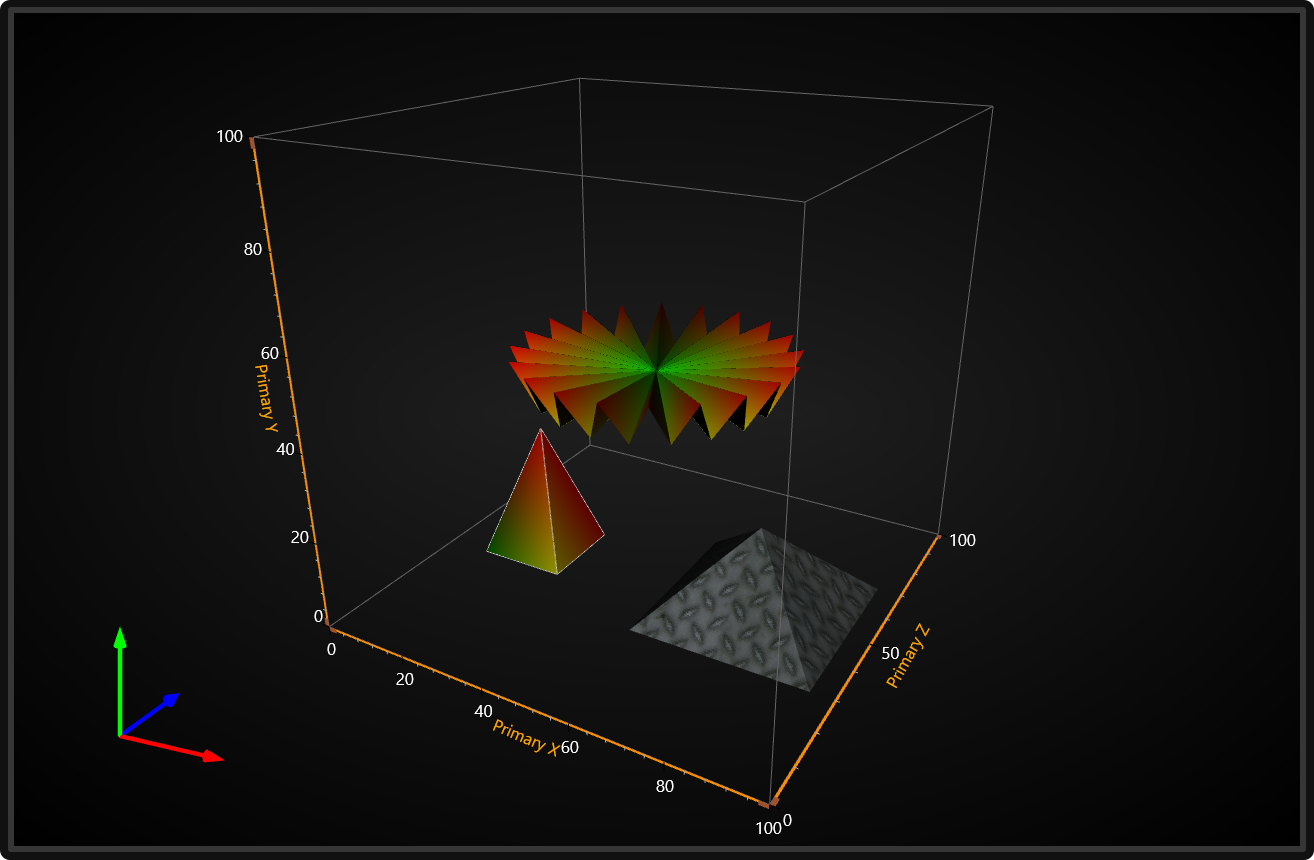
The basic 3D chart showing walls and axes is presented on the left.
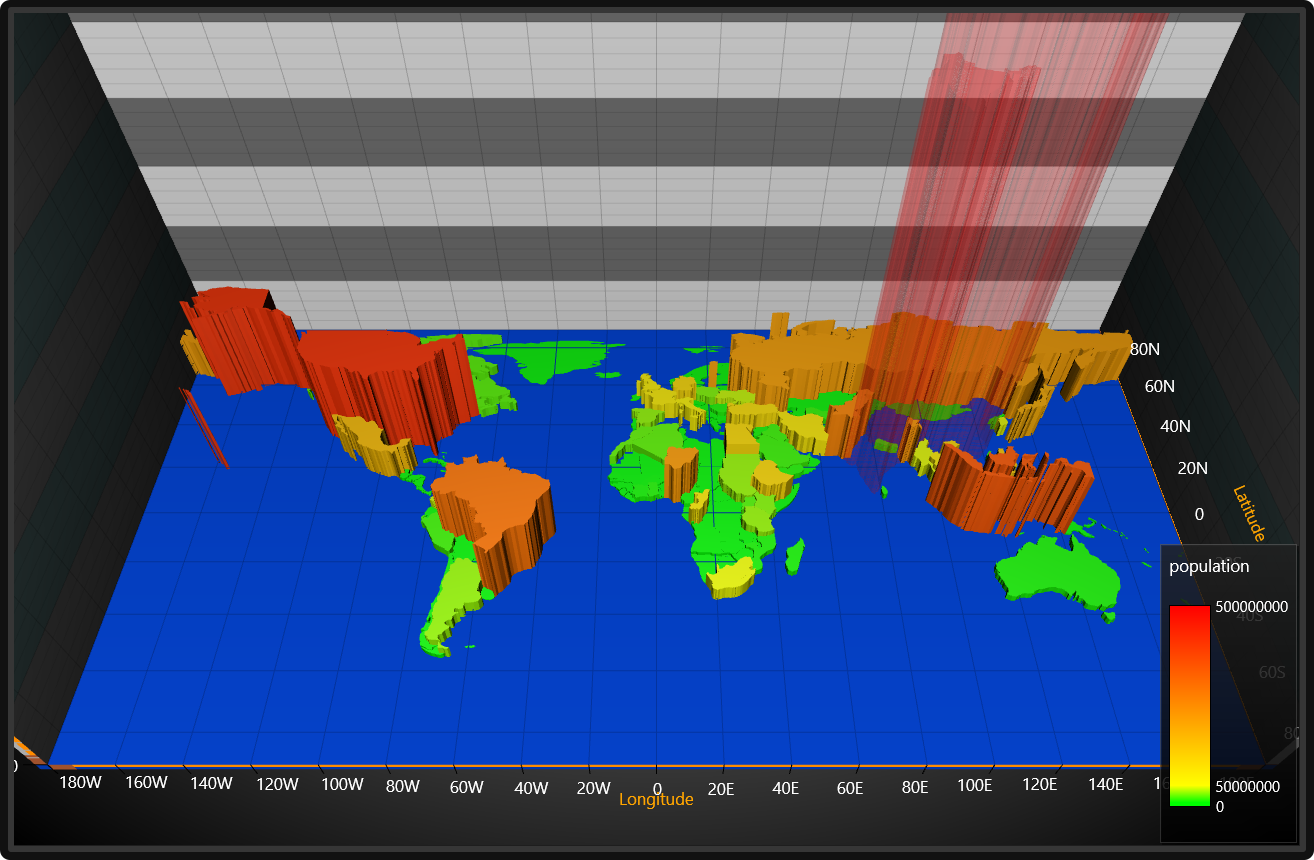
Surfaces can also be created from bitmap files.


If you have any questions, feel free to contact us!