LightningChart vs. SciChart performance comparison
LightningChart was the first manufacturer to introduce real DirectX 2D rendering for WinForms charting industry in 2009. Also, we were the first to introduce real hardware acceleration with DirectX for WPF charting industry in 2013, with low level DirectX rendering for 2D and 3D charts.
In 2013, LightningChart asked SciChart to participate in a WPF chart benchmark, where SciChart would have been given a chance to program or learn the best ways to get an optimal performance. Unfortunately, SciChart informed us that its license terms do not enable performance comparisons.
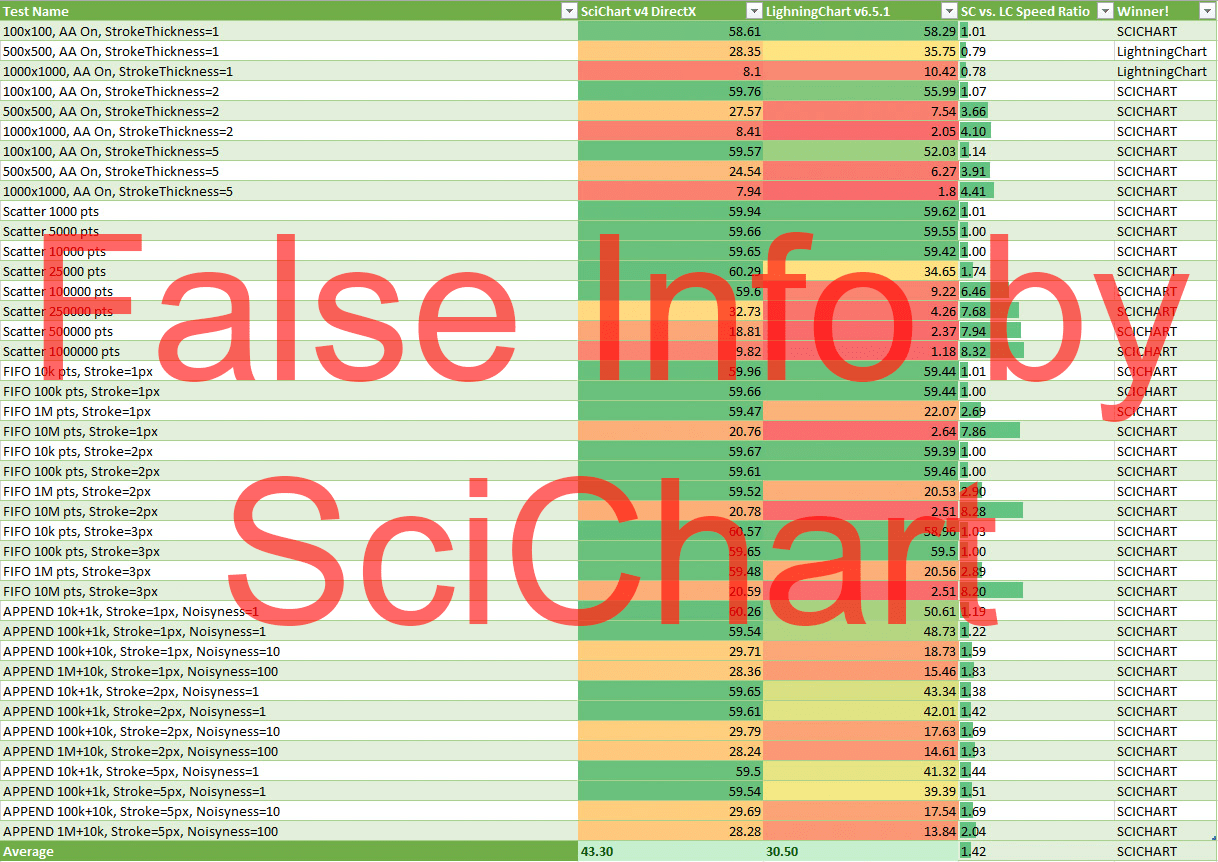
However, in the beginning of 2016 SciChart conducted a benchmark test where they compared SciChart v.4 (their newest version at that time) performance against LightningChart v.6.5.1. They claimed “SciChart is up to 8x faster than LightningChart”. We proved it wrong by fixing LightningChart usage in the performance comparison application.
SciChart provided the false results because of the incorrect test implementation.
Here are some reasons behind:
- Wrong series types were chosen for the test, as well as wrong events to control the update triggering and FPS calculation.
- All our instructions and examples from User Manual were ignored.
- The comparison was made without notifying LightningChart or asking help from our team.
- SciChart did not ask LightningChart to verify the results, so we had no chance to provide any comments and corrections to the wrong testing.
LightningChart performed the test again, so that our (and Scichart’s) customers can see the true figures and real results for their consideration. We are honest to our clients, and the testimonials show that our promises are based only on true facts and real performance capabilities.
We corrected SciChart benchmark application, to make it work somewhat optimally with LightningChart. LightningChart v.6.5.1 was used to show correct results of that benchmark, and then the tests were applied to LightningChart v.7. The results of these tests are presented below.
LightningChart is faster than SciChart up to
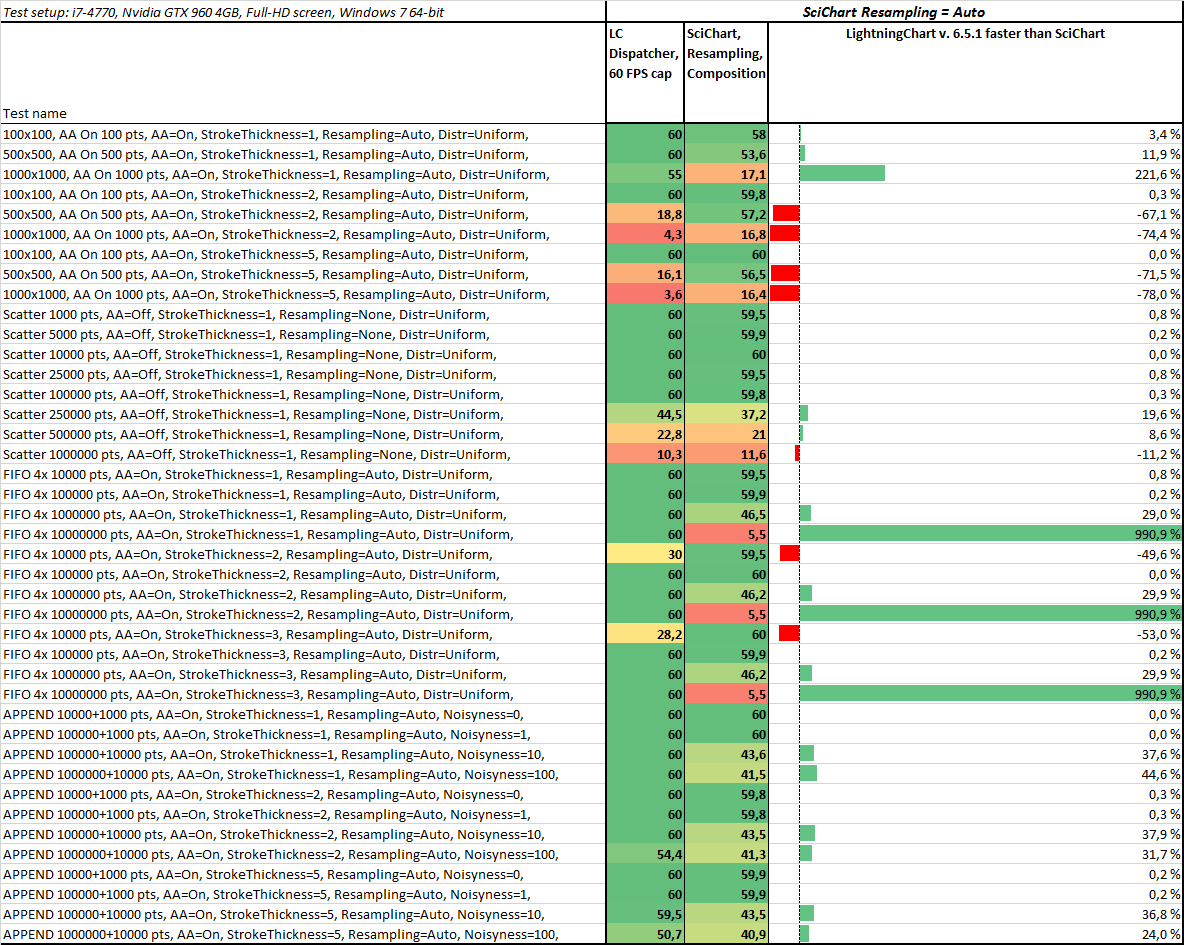
LightningChart v.6.5.1. vs SciChart
Resampling in use for Scichart
SciChart being faster up to 5x in some tests, LightningChart is faster overall, up to 14 x faster.
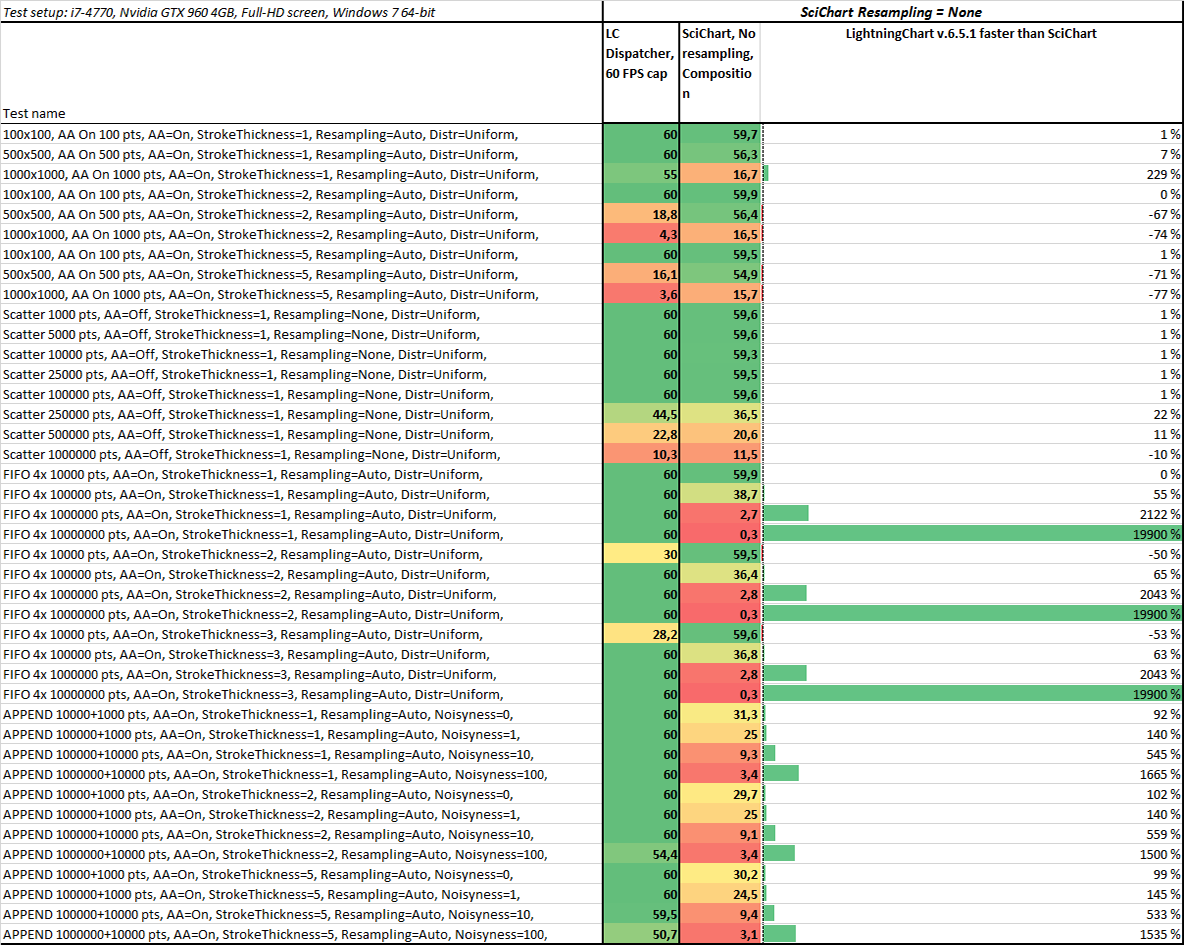
Resampling not used
SciChart being faster up to 4x in some tests, but overall LightningChart is up to 200x faster.
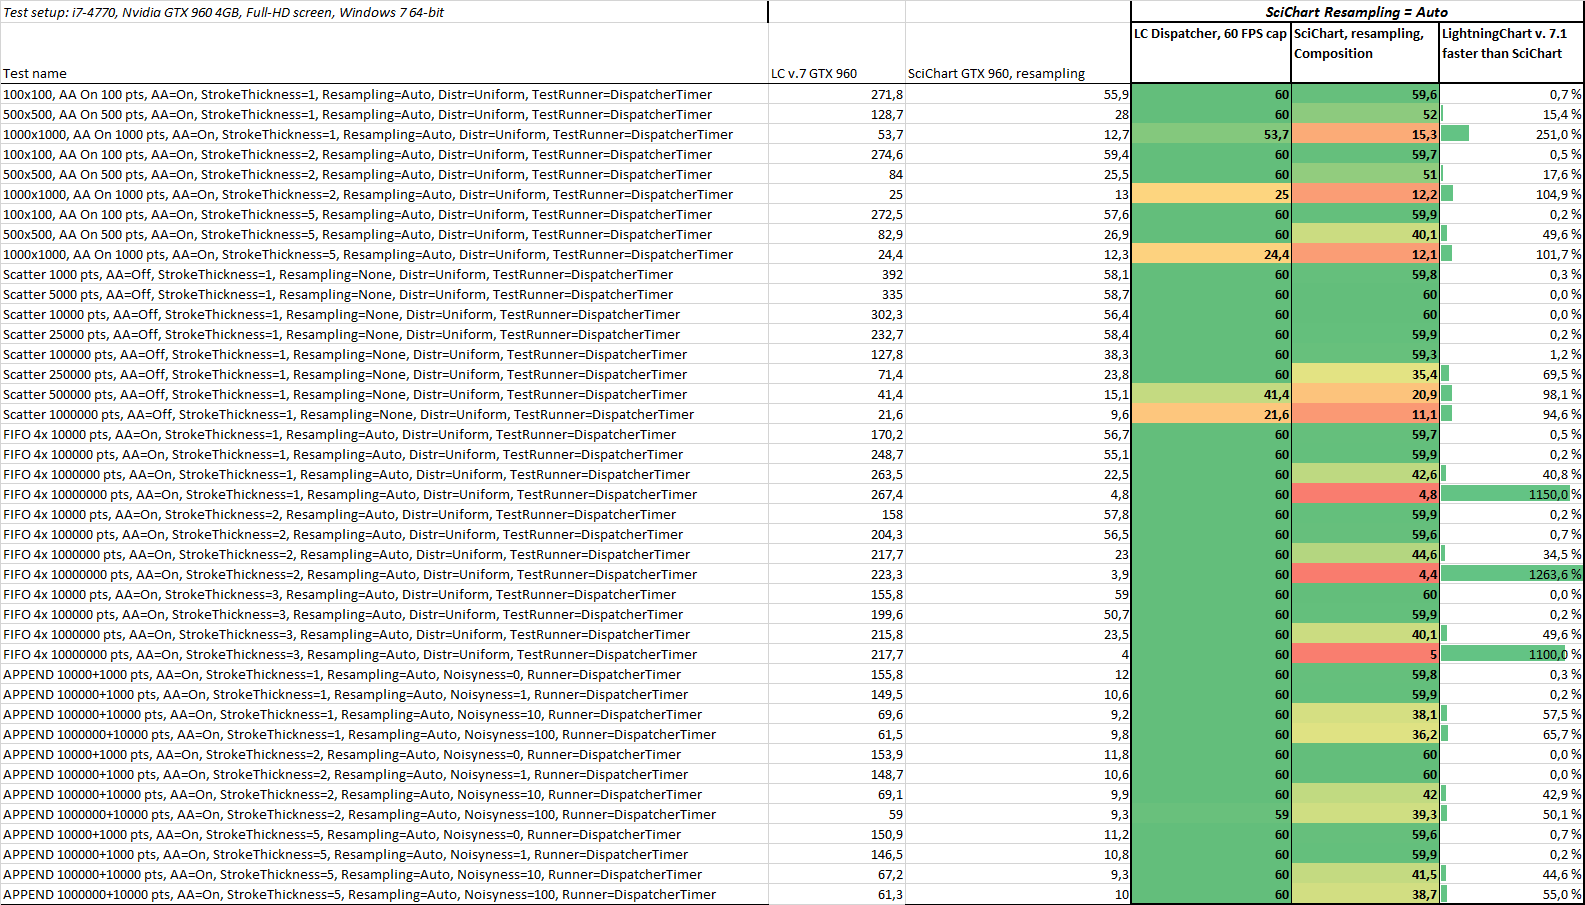
LightningChart v.7.1. vs SciChart
LightningChart 7 comes with new DirectX 11 rendering engine, so our team performed tests with it too.
Resampling in use for Scichart
LightningChart is up to 14x faster. In all tests LightningChart is faster than SciChart, excluding equal results in 60 FPS cases.
Resampling not used
LightningChart is up to 200x faster. In all tests LightningChart is faster than SciChart, excluding equal results in 60 FPS cases.

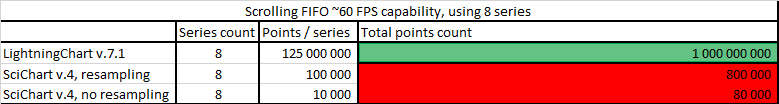
Resampling mode conclusion:
When using 8 series, LightningChart can render 8 x 125 million points with 60 FPS, while SciChart starts to slow down at 8 x 100000 points, when SciChart is using resampling. LightningChart data plotting capacity is 1250 times better in this test.
No sampling mode conclusion:
When using 8 series, LightningChart can render 8 x 125 million points with 60 FPS, while SciChart starts to slow down at 8 x 10000 points, when not using resampling. LightningChart data plotting capacity is 12500 times better in this test.
If you have any questions, feel free to contact us!