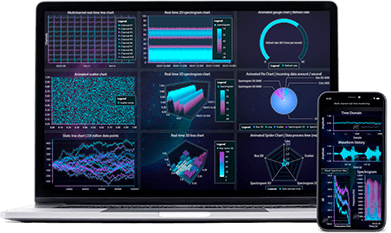
Lightning-fast, interactive & responsive 2D & 3D
JavaScript charts.
Next Generation, World’s Fastest JS Charts
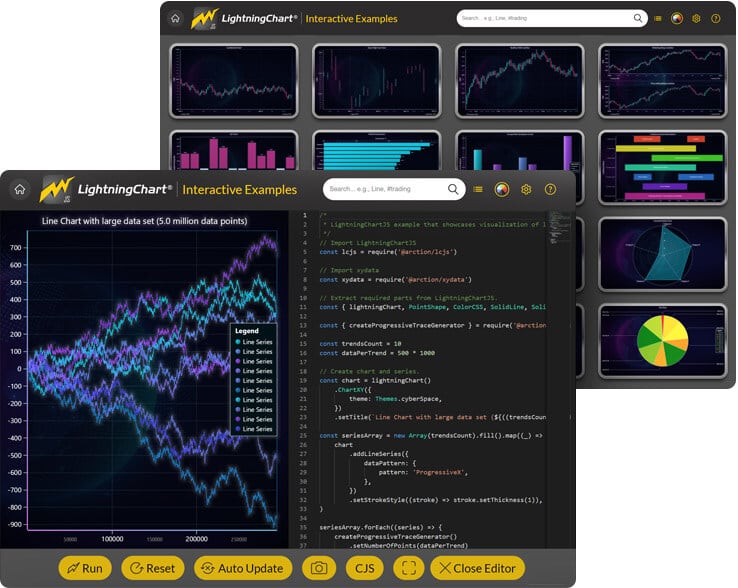
JS Interactive examples
Interactive Examples is an easy-to-use exploration tool to help you get started quickly with the most important concepts. In here you can search, view and edit charts on-the-fly.
API-links can be found conveniently right next to each example and below the chart example there is a link to the example’s GitHub page.

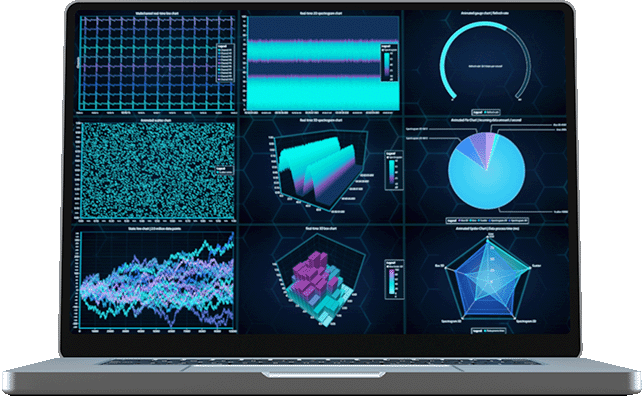
Unmatched Performance Level
LightningChart JS comes with an unmatched execution performance. GPU acceleration & WebGL rendering ensure that your device’s graphics processor is efficiently used, resulting in fast data loading, high refresh rates, and smooth interactions. LightningChart JS combines incredible speed with sturdy load capacity. Discover the real meaning of the world’s highest performance in JavaScript charts.
LightningChart JS performance feats
- Static line series: 10 million data points in 290 ms. Up to several billion samples.
- Scrolling line series: 400 channels simultaneously with 1000 Hz data stream rate per channel and 1-minute time window, adding up to a total of 24 million data points visible at every frame and updated at 60 FPS
- Heatmaps: 30000 x 30000 heatmap can be loaded in less than 5 seconds
- Scatter series: load massive raw datasets up to 500 million samples (and more depending on hardware)
- Dashboards: display up to 1000s of charts on the same page
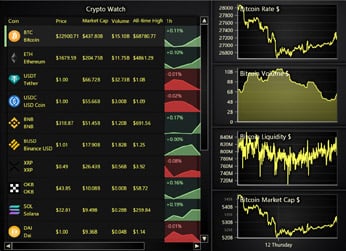
Introducing DataGrid
An additional grid control compatible with all library visualizations for LightningChart JS V.4.0 or higher.
In dashboards or as a standalone application, the DataGrid component can be utilized for sophisticated real-time status monitoring.
All forms of contents are supported by Data-Grid, along with features like cell merging, in-cell spark charts, user interactions, and dynamic cell coloring.

More Chart Types
XY Charts
XY Charts
- Series types: Line and point series, area series, area range series, rectangles, ellipses, box-whisker and line segment series.
- Linear axes can be placed left/right/top/bottom and possibility to have several X and Y axes per chart.
- Scaling modes include fitting, Expansion, Progressive/ Regressive and Manual.
- Markers and data cursors have customizable shape and styles.
- Logarithmic Axes
- Can be used with Numeric TickStrategies as well as DateTime TickStrategies.
- Base number can be set per Axis by users.
- Available with XY charts, supported series types: Line, Point, PointLine, Step, Spline, Area, AreaRange, Rectangle, Segment.
Advanced 3D Charts
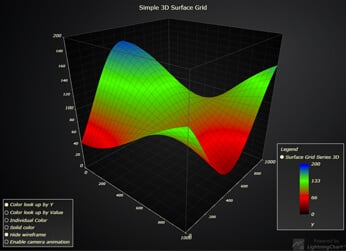
Advanced 3D Charts
- Series types: Line series, Point series, PointLine series, PointCloud series, Box series, Surface series.
- Customize the shape of the Bounding Box of the 3D Chart.
- Linear Axes for X, Y and Z planes around Bounding Box of the 3D Chart.
- Use Numeric and DateTime format with Axis ticks.
- Camera can be controlled to rotate around and zoom in / out of the Chart area.
- 3D box series
- Customizable with value based coloring, solid coloring for all boxes, individual box colors, and the roundness of the Box Shape edges.
- Supports dynamic coloring by x, y or z coordinates.
- 3D surface series
- Customizable with: value based coloring, solid coloring, Data-Point based coloring.
- Comes with customizable wireframe.
Heatmaps
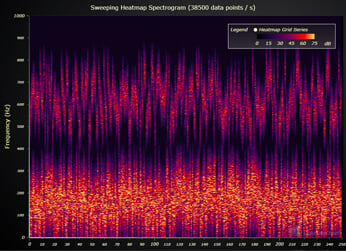
Heatmaps
- Usable in XY Charts.
- Create a 2D rectangular heatmap using the IntensityGrid option.
- Create a 2D mesh Heatmap using the IntensityMesh option.
- Use Heatmaps to create Spectrograms.
Data Grid
Data Grid
Grid control that can be used as a standalone application or within a dashboard.
- Unlimited rows and columns.
- Supports text, numbers, images, icons, spark charts, etc.
- Supports cell merging, dynamic coloring, full customization.
Polar Charts
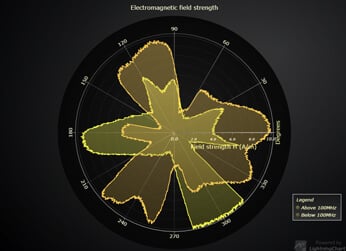
Polar Charts
- Series Types (all stylable with familiar API): Line series, Point series, PointLine series, Polygon series and Area series.
- Polar Sectors (easily stylable with familiar API). Highlight a section of the Polar Chart with ease.
- Can be rotated via API.
- AutoCursor is available for Polar Charts.
- Can be used as a stand-alone Chart, or in a Dashboard.
Pie / Donut charts
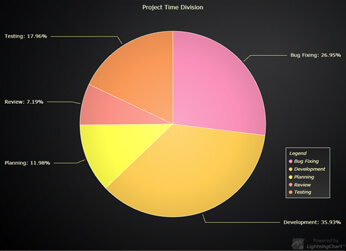
Pie / Donut charts
- Slices can be styled using different fill and border-styles.
- Fully customizable sorting and formatting of Slices.
- Slice value transitions as well as disposing/restoring are animated.
- Two designs:
- Labels on side with connector-lines
- Labels inside Slices
- Slices can be “exploded” programmatically or by mouse/touch.
Funnel Charts
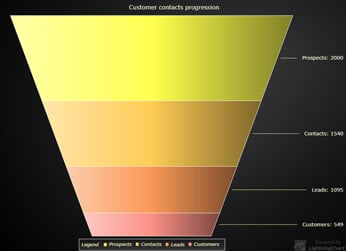
Funnel Charts
- Slices can be styled using different fill and stroke styles.
- Slices can have empty gaps in between.
- Fully customizable sorting and formatting of slices.
- Labels can be set on side with connector lines or inside slices.
- Two different ways to show the slices based on their values: Variable width and Variable height.
- Slices can be animated. Changing values of slices, adding and removing slices support animations.
- User can enable or disable animations for all slices.
Gauge Charts
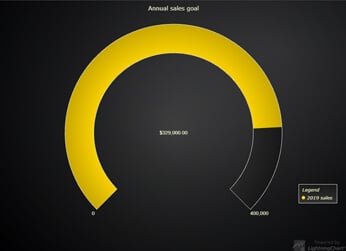
Gauge Charts
- Gauge can be styled using different fill and stroke styles.
- Set the thickness of the Gauge.
- Gauge Slice can be styled using different fill styles.
- Fully customizable formatting and styling of slices.
- Customize the start and end angles of the gauge.
- Customize the value interval of the gauge.
- Gauge value change, interval and angle transitions and gauge dispose/restore are animated.
Pyramid Charts
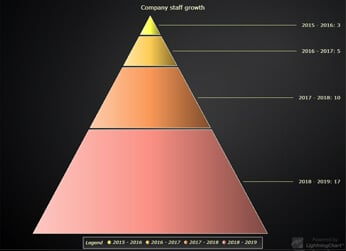
Pyramid Charts
- Slices can be styled using different fill and stroke styles.
- Slices can have empty gaps in between.
- Fully customizable sorting and formatting of slices.
- Labels can be set on side with connector lines or inside slices.
- Slices can be animated. Changing values of slices, adding and removing slices support animations.
- User can enable or disable animations for all slices.
Radar / Spider charts
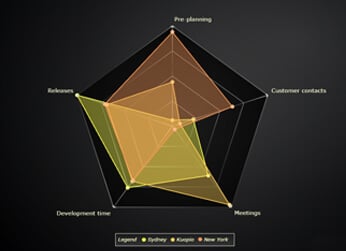
Radar / Spider charts
- Categorical automatically generated axes.
- Round and lines grid.
- Line, point and filled area series.
- Scaling modes include fitting, expansion and manual.
- Data cursors have customizable shape and styles.
Map Charts

Map Charts
- Can be used as a stand-alone Chart component or placed inside a Dashboard.
- Supports following views: World, USA, North America, South America, Canada, Europe, Asia, Africa and Australia.
- Supports Auto Cursor feature for displaying region data with mouse.
- Can be colored with solid color for entire map, or with dynamic color per region.
- Supports LUT UI element for visualizing dynamic color table.
- Supports real-time updates.
Intuitive User Experience
Dashboard
Easy and convenient to manage dozens of charts, legend boxes, buttons, check boxes and other UI elements. Resource-efficient rendering of all charts in one GPU scene also makes resizing columns and rows very fast.
Interactive Charts
JavaScript Charts with smooth animations exceeding all industry standards in amount of data per chart. Intuitive touch screen interactivity with zooming, panning, moving data cursors etc.
WebGL rendering
GPU acceleration & WebGL rendering ensure that your device’s graphics processor is utilized efficiently, which results in outstanding execution performance.
Server side rendering
LightningChart JS supports Server side rendering. It can be used with our headless package available in npm. Use our charts in a server application to produce high-quality chart images.
Documentation
With LightningChart JS you have an abundance of resources to get cosy with the library. API documentation, interactive examples and more – visit our resources page to access all this.
LightningChart JS License key
Get a license key
LightningChart JS usage requires a license key regardless of your library status (paid or trial).
There are three ways to get a license key:
3) Access the 30-day Non-commercial license (no technical support / deployment licenses)
License type |
Publisher |
SaaSFrom $2500 |
Application DeveloperFrom $3200 |
Enterprise |
|---|---|---|---|---|
2D charts |
|
|
|
|
3D charts |
|
|
|
|
Commercial use for web site (no login) |
|
|
|
|
Intranet servers |
|
|
|
|
SaaS (web site requiring login) |
|
|
|
|
Installable / Salable Applications, Desktop / Mobile / Embedded |
|
|
|
|
Commercial use |
|
|
|
|
LightningChart Logo Removed |
|
|
|
|
Examples source code |
|
|
|
|
Libraries source code available for purchase at extra cost |
|
|
|
|
Technical support |
|
|
|
|
Deployment rights |
Per domain, check deployment domains. |
Per domain |
Unlimited per application, royalty-free. |
Please ask us. |
Features & Requirements
See all the details regarding compatible web browsers, product features, compatible frameworks, chart types and
technical (e.g. internet connection, software and hardware) requirements.
Frequently Asked Questions
What is LightningChart JS, and how does it differ from traditional charting libraries?
LightningChart JS is a GPU-accelerated and WebGL-based JavaScript charting library designed for creating high-performance data visualization applications. Unlike traditional js charting libraries, LightningChart leverages the power of the device’s graphics processor, resulting in efficient data loading, high refresh rates, and smooth interactions, making it significantly faster and more capable of handling large datasets.
How does LightningChart JS handle real-time data plotting compared to traditional graph libraries?
LightningChart JS is specifically designed for real-time data plotting, offering high-performance updates and smooth transitions even with constantly changing data streams. Traditional graph libraries may struggle with real-time plotting due to limited performance, whereas LightningChart JS utilizes GPU acceleration and LightningChart’s proprietary, super-efficient rendering techniques, to ensure a seamless real-time plotting experience.
Can LightningChart JS be integrated with different frontend frameworks?
Yes, LightningChart JS provides integration support for various frontend frameworks and technologies such as React, Angular, Vue.js, ASP.NET, Blazor, Xamarin, iOS, Android, and more. This flexibility enables developers to seamlessly embed LightningChart into their preferred development environment.
How can I install and use LightningChart JS with ReactJS?
You can install LightningChart JS in a ReactJS project using npm or yarn. After installation, you can use LightningChart API to create your own LC-based React chart components and start utilizing powerful data visualization features.
Is LightningChart JS suitable for cross-platform development?
Absolutely, LightningChart JS is designed to work seamlessly across web, mobile, and desktop platforms. Its cross-platform compatibility ensures consistent performance and visual appeal across different devices and operating systems. It’s compatible with Windows, MacOS, Linux, Android and iOS.
What are the benefits of using GPU acceleration and WebGL rendering in LightningChart JS?
GPU acceleration and WebGL rendering in LightningChart JS result in efficient data loading, high refresh rates, smooth interactions, and minimal CPU overhead. This technology significantly enhances the performance of data visualization applications, making them faster and more responsive, even with large datasets.
What kind of amounts of data, can I visualize with LightningChart JS?
A: When visualizing a line chart, as a static dataset, the maximum amount of data can be several Billion data points. In real-time charting applications, 400 trends simultaneously with 1000 data points / s, keeping the refresh rate smooth at 60 FPS. The number of line charts visualized in real-time can exceed 4000. In heatmap charts, around 2 Billion data points are within possibilities.
Can I use LightningChart JS in Fintech (finance/banking/trading) applications?
LightningChart® JS is intended for scientific and engineering applications. It lacks some of the features needed in the industry, such as Technical Analysis charts, candlestick charts, and trading bar charts. To develop fintech applications, use LightningChart® JS Trader, which has all the features of LightningChart JS included, and more: Technical Analysis charts are included with 100+ indicators, custom candlestick and trading bars charts can be created, and DataGrid can be utilized to create portfolio views and market watch dashboards.
Are you still not convinced?
Here are 5 reasons Why LightningChart JS is the best charting solution.
See more: Troubleshooting | EULA
If you have any questions, feel free to contact us!
©LightningChart Ltd 2024. All rights reserved.