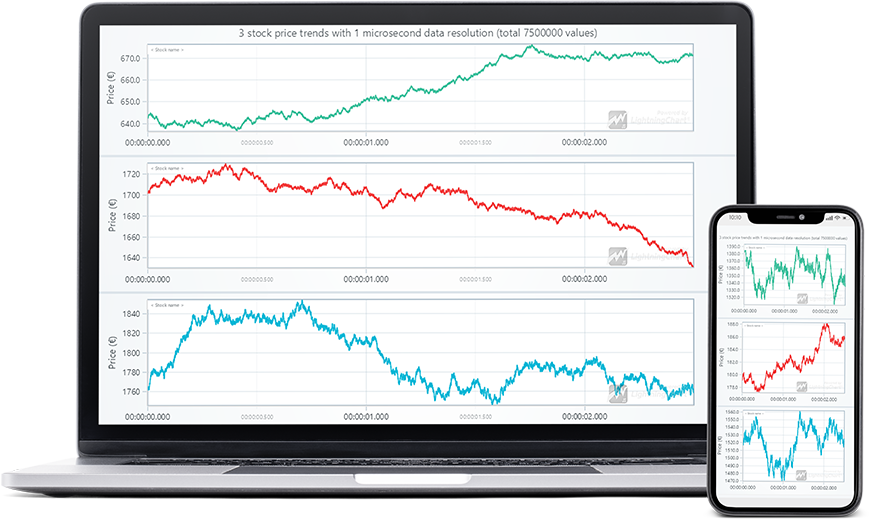
World's Fastest Rendering Data Visualization Controls for Building Stunning Apps
Run light-weight dashboard Run extreme dashboard
World's Fastest Rendering Data Visualization controls for building stunning apps
World's Fastest Rendering Data Visualization controls for building stunning apps
Next-generation charting apps are built with LightningChart
LightningChart is the most powerful high-performance charts framework ready to fulfill any performance requirement.
Develop real-time and demanding data visualization applications thousands of times more powerful than any other charting library.
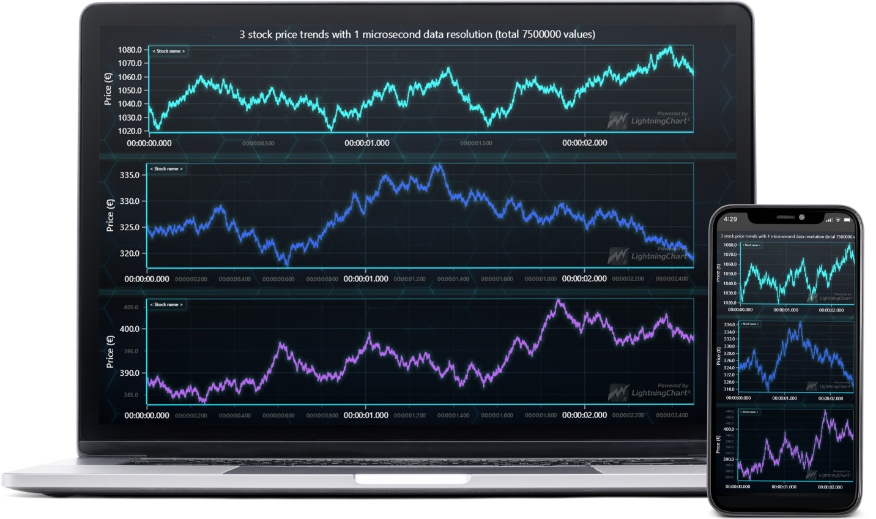
Modern & cross-platform app development
( { theme. )
Integrate beautiful high-performance charts and dashboards into web, mobile, cloud, desktop, server, IoT, and intranet applications.
Faster development using our 10+ project templates available.
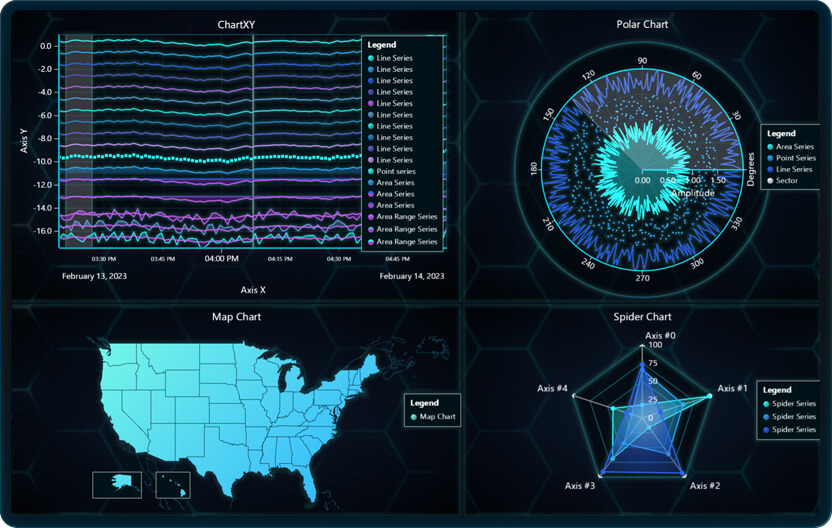
Beautiful data visualizations
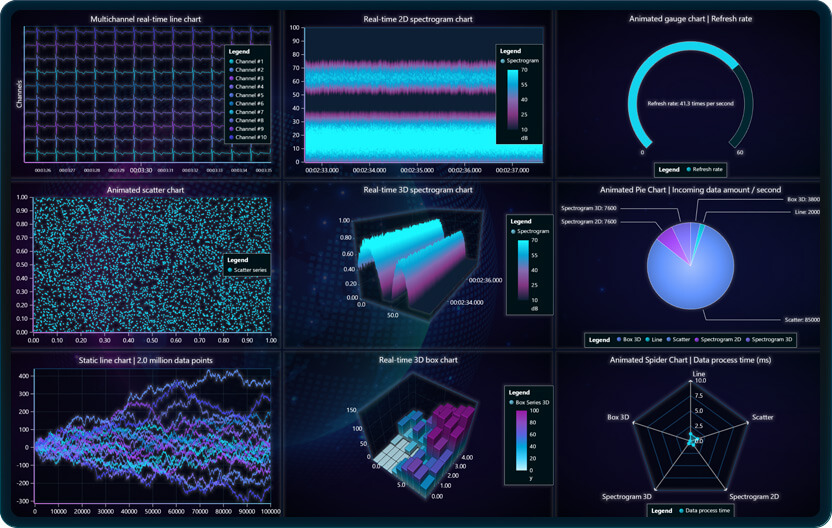
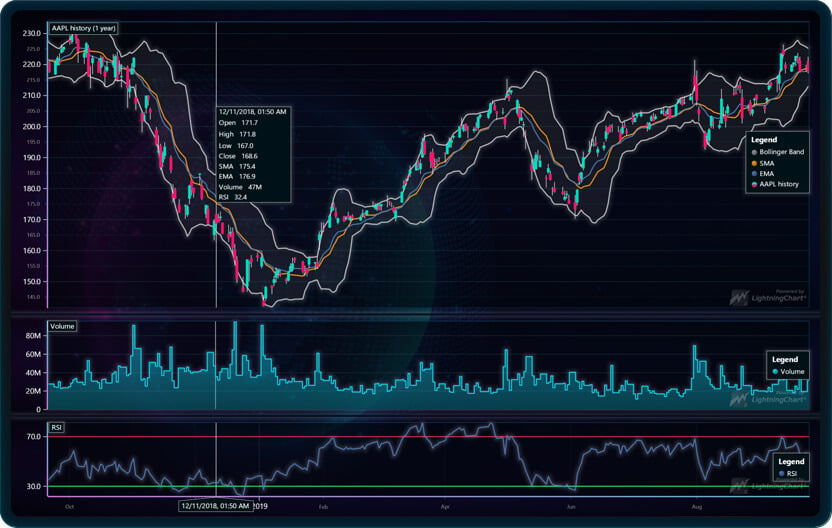
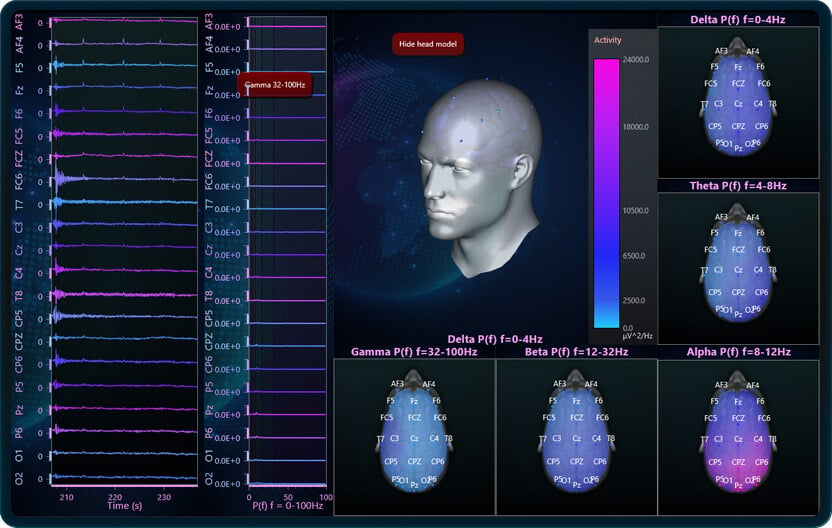
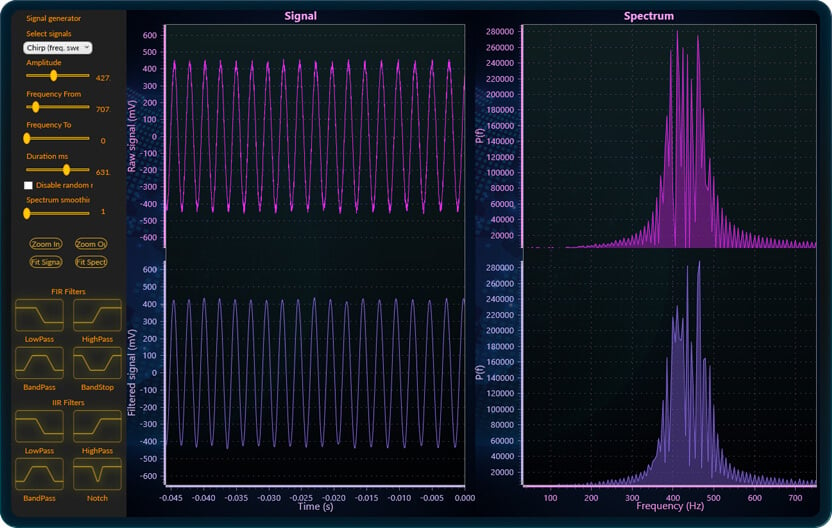
Use LightningChart high-performance charts components as standalone dashboards or integrate them to users applications.
Adjust themes, colors, and features to your liking with fully customizable charts without compromising performance.
See More ChartsWhy performance matters in data visualization?
High-performance guarantees faster and more efficient components and applications.
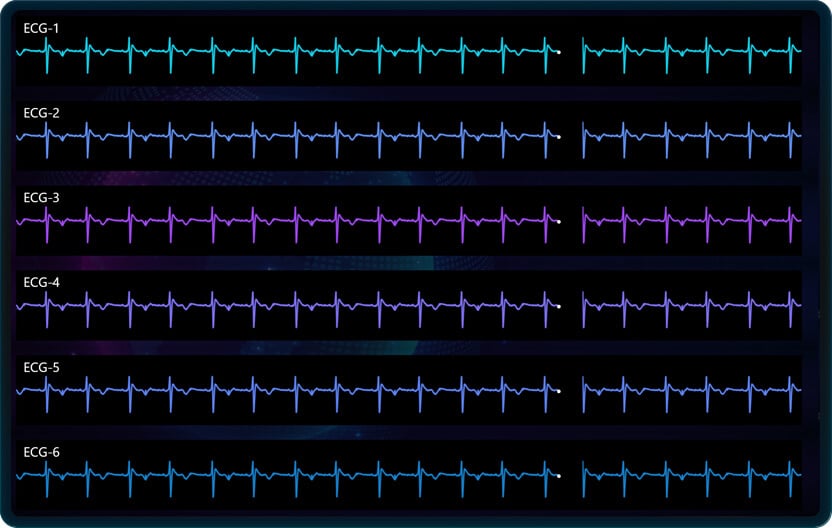
The secret of LightningChart high-performance charts components is hardware-accelerated visualizations that unlock larger processing power and better user experiences made for intensive real-time applications.
Graphics technologies
LightningChart JS and .NET use the latest WebGL and DirectX technologies, respectively.
WebGL and DirectX technologies secure that applications will redraw and update graphics at lightning speeds, handle more data, and reduce the computing power requirements.
Benefits of GPU-acceleration
LightningChart high-performance charts components offload the heaviest computations to GPU's, which are relatively much more powerful than CPU's.
LightningChart’s visualization controls are GPU-accelerated charts rendered at the highest FPS and fastest load-up speeds.

Most popular .NET charting control
in Visual Studio Marketplace
25,000
TIMES INSTALLED

LightningChart .NET
visualizes up to
1,000,000,000,000
DATA POINTS

LightningChart JS
visualizes up to
2,000,000,000
DATA POINTS

More than
200 VISUALIZATION EXAMPLES
Up to
1,000,000 TIMES FASTERTHAN OTHER LIBRARIES
Download LightningChart
LightningСhart JS
Best for developing web, mobile, desktop, IoT, Cloud, and Intranet applications that require fast data processing times.
The library features 100+ charts, examples source code, and 10+ framework templates including Angular, React, Quasar JS, Ionic, etc.
WebGL-rendered and GPU-accelerated charts for delivering the highest performance and the best user experience.
LightningСhart .NET
Ideal for developing highly demanding desktop applications, e.g., scientific, engineering, finance, medicine, etc.
The library features 100+ chart types, signal tools, and examples source code supported in WinForms, UWP, and WPF.
Hardware-accelerated controls for lightning-fast rendering performance and efficient use of resources
Read our success stories
Husqvarna AB
Husqvarna has developed a software tool that measures real-time log data from the outdoor power tools’ motors and displays it in a chart using LightningChart high-performance charts.
Müller BBM-VAS
The PAK cloud services provide an infrastructure that enables data management across multiple data sources and applications, specifically designed to capture dynamic and physical data.
SES S.A.
SES is working on developing a satellite telemetry web application featuring high-performance charts and data visualizations. This innovation will be used in SES satellite network operations center for controlling satellites and conveying offline historical data analysis.
